Entry Speed vs Confirmation Quality in Tick-Level Scalping
Abstract
We study the trade-off between entry speed and confirmation quality across 21,000 scalping signals over 90 days. Using 42.9 million ticks of XAUUSD data, we show that the edge in consecutive-bar reversal signals is maximal at the exact instant price crosses last_close and decays rapidly. Pending STOP orders at the break level outperform all confirmation-based entries by $12,646, with a profit factor of 1.59 vs 1.34. Every post-hoc sustain filter tested produced negative returns at all parameter combinations.
1. Introduction
1.1 The Retracement Scalping Literature
Mean-reversion at the intraday scale is one of the most extensively documented microstructure phenomena in equity and FX markets. The core observation — that a sequence of same-direction bars is followed by a statistically significant counter-move — appears in virtually every liquid instrument and has been exploited by market makers and proprietary traders since electronic trading began. In precious metals markets, the effect is particularly pronounced on XAUUSD M1 bars, where the combination of high volatility (~15% annualised), tight spreads ($0.20–$0.30 during London/NY sessions), and strong institutional participation creates a fertile ground for retracement scalping strategies.
The academic literature on mean-reversion scalping has focused primarily on signal detection — identifying which patterns predict reversals — while treating execution as a secondary concern. Hasbrouck (2007) documents the importance of latency in equity market making, and Budish et al. (2015) quantify the arms race in HFT speed, but neither addresses the specific question faced by retail and semi-institutional traders: given a valid retracement signal, how much edge is lost per unit of entry delay?
1.2 The Latency-Edge Hypothesis
We hypothesize that the retracement scalping edge on XAUUSD M1 is a transient microstructure phenomenon that exists at the exact instant price crosses the break level and decays monotonically thereafter. This hypothesis implies that any execution method introducing delay — including waiting for price confirmation, sustain filters, or client-side polling loops — will underperform a zero-latency pending order placed at the break level before the break occurs.
The mechanism is straightforward: in a market with a mean TP target of ~$2.50, even small amounts of adverse price movement consume a disproportionate fraction of the expected profit. If the mean slippage from a 5-second delay is $1.38, that delay alone erases 55.2% of the expected profit on the trade.
1.3 Contribution
This paper presents, to our knowledge, the first tick-level quantification of entry decay for retracement scalping on XAUUSD M1. Using 42.9 million ticks across 90 trading days and 21,009 retracement signals, we:
- Document the complete signal detection algorithm, including dual-path (mid-bar and confirmation) detection with deduplication logic
- Characterize the entry mechanics of MT5 pending STOP orders versus market orders
- Quantify the exact PnL impact of three entry methods: break, confirmation, and sustain-wait
- Show that all 40 combinations of sustain window × threshold produce negative total PnL
- Measure entry slippage as a continuous function of delay and demonstrate monotonic edge decay
2. Signal Detection
2.1 Forming Run Detection (Path 1 — Mid-bar Entry)
The primary signal detection algorithm examines the currently forming bar (bars[-1]) to identify runs in progress, enabling entry before the run bar closes. This is the fastest possible detection path.
The algorithm proceeds as follows:
- Examine the currently forming bar (the most recent bar). Compute the body percentage as $\text{body\%} = \frac{|C - O|}{O} \times 100$. If this falls below the minimum body threshold, no signal is generated. Otherwise, classify the bar direction as bullish (+1) if the close exceeds the open, or bearish (−1) otherwise.
- Count backwards through preceding closed bars. For each bar whose direction matches the forming bar and whose body percentage meets the threshold, increment the consecutive bar count and accumulate the total body size. Stop at the first bar that breaks the pattern.
- If the consecutive count is below the minimum required (2 or 3, depending on configuration), no signal is generated. Otherwise, return the signal with the run direction, consecutive count, cumulative body percentage, the forming bar's timestamp (for deduplication tracking), and the entry mode tagged as "mid-bar."
The body percentage calculation normalises the body size relative to the instrument price, making the threshold meaningful across different price levels. For XAUUSD trading near $2,600, a body threshold of 0.03% corresponds to approximately $0.78, while 0.05% corresponds to approximately $1.30. These thresholds filter out doji-like bars with negligible directional commitment.
Two body thresholds and two minimum run lengths are tested:
| Parameter | Values Tested | Interpretation |
|---|---|---|
| Minimum body percentage | 0.03%, 0.05% | Minimum body as percentage of open price for each bar in the run |
| Minimum consecutive bars | 2, 3 | Minimum number of consecutive same-direction bars required |
The entry mode is tagged as "mid-bar" in the trade log, allowing post-hoc separation of mid-bar entries from confirmation entries in performance analysis.
2.2 Confirmation Run Detection (Path 2 — Fallback)
The secondary detection path fires on closed bars only. It examines the second-to-last bar as the last bar of the potential run and the most recent bar as the confirmation bar that has already broken the pattern (i.e., closed in the opposite direction or with insufficient body). The counting logic is identical to Path 1 but shifted by one bar: starting from the second-to-last bar, it counts backwards through preceding bars that match in direction and meet the body threshold. If the consecutive count meets the minimum, a signal is returned with the entry mode tagged as "confirmation."
This path exists as a safety net: it catches signals where the mid-bar detection (Path 1) missed the tick window because the forming bar had not yet met the body threshold when the polling cycle ran. In production, Path 2 fires approximately 15–20% of the time, with the remainder captured by Path 1.
2.3 Deduplication Guard
Both paths can potentially fire on the same signal, creating a double-trade risk. Consider the scenario: Path 1 detects a forming run on the most recent bar at time $T$. On the next polling cycle, the bar has closed and Path 2 detects the same run shifted by one position, also referencing time $T$.
The deduplication mechanism maintains a set of bar timestamps for every signal processed by Path 1. When Path 2 fires, it checks whether the second-to-last bar's timestamp exists in this set. If it does, the signal is suppressed as a duplicate.
A dedup bug was discovered on 2026-03-09 where both paths fired on the same run because the mid-bar detection tracked the most recent bar's timestamp while confirmation checked the second-to-last bar's timestamp, and these referred to different bar positions. The fix ensures Path 2 checks the correct bar time against the dedup set. All data after ticket 118153099 (row 351 in the trade log) uses the corrected dedup logic.
3. Entry Mechanics
3.1 Pending STOP Orders
The break entry uses a pending STOP order placed at the close of the last run bar. The reversal trade direction is opposite to the run: a bullish run (consecutive up bars) produces a SELL signal, and the STOP is placed as a SELL_STOP below the last close. A bearish run produces a BUY_STOP above the last close.
The stop price is set to the last run bar's close (the reversal level). For a BUY signal (after a bearish run), a BUY STOP order is placed if the stop price is above the current ask; otherwise, a market BUY order is used as a fallback since price has already passed the level. For a SELL signal (after a bullish run), a SELL STOP is placed if the stop price is below the current bid; otherwise, a market SELL order is used.
The critical advantage of the STOP order is that it delegates fill execution to the MT5 server, which monitors ticks continuously and fills the order at the exact moment price crosses the stop level. This achieves zero polling latency — the fill occurs at tick granularity regardless of the client-side polling interval.
STOP orders that are not filled within 3 bars are automatically cancelled. If the price has already passed the stop level at order placement time (e.g., price moved during the polling interval), the system falls back to an immediate market order. This fallback ensures no signal is entirely missed, though the fill price will be worse than the ideal break level.
3.2 Filling Modes
MT5 supports three order filling modes, and the correct mode depends on the broker and order type. For the broker used in this study:
| Order Type | Filling Mode | Constant | Behaviour |
|---|---|---|---|
| Market orders (BUY/SELL) | Immediate or Cancel | ORDER_FILLING_IOC | Fill available volume, cancel remainder |
| Pending STOP orders | Return | ORDER_FILLING_RETURN | Place unfilled remainder as new order |
A helper function for automatic filling mode detection exists in the codebase that queries the broker's supported modes, but it was found to return incorrect values for this specific broker (it tested FOK first, which is not supported). The production system bypasses this function and uses hardcoded filling modes at three locations in the execution code (market order entry, STOP order placement, and breakeven modification).
4. Strategy Configurations
Seven distinct configurations are tested, varying the body threshold, minimum consecutive bars, exit mode, and lot sizing. Each configuration runs as a separate magic number in MT5, allowing simultaneous live execution and independent performance tracking. The config names (0.03, 0.05) refer to body percentage thresholds, not lot sizes — actual MT5 lots are dynamically sized between 0.01 and 0.10 based on account equity and tier multipliers.
| Config Name | Body% | Min Consec | TP Fraction | SL Multiplier | Timeout (bars) | Base Lot | Magic | Exit Mode |
|---|---|---|---|---|---|---|---|---|
| 0.05, 3+ | 0.05% | 3 | 0.20 | 4.0 | 3 | 0.05 | 990 | TPSL |
| 0.03, 3+ | 0.03% | 3 | 0.25 | 2.0 | 3 | 0.04 | 991 | TPSL |
| 0.03, 2+ | 0.03% | 2 | 0.33 | 2.5 | 3 | 0.02 | 992 | TPSL |
| 0.05, 3+, RB | 0.05% | 3 | — | — | — | 0.05 | 993 | RevBE |
| 0.03, 3+, RB | 0.03% | 3 | — | — | — | 0.04 | 994 | RevBE |
| 0.03, 2+, RB | 0.03% | 2 | — | — | — | 0.03 | 995 | RevBE |
| 0.03, 2+, XAG | 0.03% | 2 | 0.33 | 2.5 | 3 | dynamic | 996 | TPSL |
Config 996 uses XAG-scaled lot sizing (see companion paper on directional disagreement). The base lot scales by a tier multiplier derived from the directional disagreement metric ($d_{20}$) and the XAG last-bar reversal flag, producing effective lots between 0.5x and 1.5x of the base.
5. Exit Mechanics
5.1 TPSL Mode
The TPSL exit mode computes take-profit and stop-loss levels as functions of the run's total body size, ensuring exits are proportional to the signal strength:
The take-profit and stop-loss levels are computed as follows:
$$\text{TP}_{\text{pct}} = \frac{\text{total\_body\_pct} \times \text{tp\_fraction}}{100}$$ $$\text{SL}_{\text{pct}} = \text{TP}_{\text{pct}} \times \text{sl\_multiplier}$$For BUY trades (after bearish run):
$$\text{TP}_{\text{price}} = \text{entry} \times (1 + \text{TP}_{\text{pct}}), \quad \text{SL}_{\text{price}} = \text{entry} \times (1 - \text{SL}_{\text{pct}})$$For SELL trades (after bullish run):
$$\text{TP}_{\text{price}} = \text{entry} \times (1 - \text{TP}_{\text{pct}}), \quad \text{SL}_{\text{price}} = \text{entry} \times (1 + \text{SL}_{\text{pct}})$$A timeout exit closes at market after the configured number of completed bars (default 3).
The TP fraction parameter controls what percentage of the run body the TP captures. A value of 0.25 means the TP targets 25% of the total run body — a conservative target reflecting the empirical finding that most reversals retrace only a fraction of the preceding run. The SL multiplier sets the SL as a multiple of the TP distance, creating asymmetric risk/reward ratios (e.g., 2.0x means the SL is twice the TP distance).
For the 0.05%, 3+ config (magic 990), with a typical 3-bar run totalling 0.20% body on a $2,600 price: $\text{TP}_{\text{pct}} = 0.20 \times 0.20 / 100 = 0.0004$, giving TP = $2,600 × 1.0004 = $2,601.04 and SL = $2,600 × (1 - 0.0016) = $2,595.84. This produces a TP of ~$1.04 and SL of ~$4.16, for an R:R of 1:4.
5.2 RevBE (Reversal-Breakeven) Mode
The RevBE exit mode uses a more complex, event-driven exit logic designed to capture larger reversals while limiting downside through an automatic breakeven mechanism:
- Reversal bar exit: If the first bar after entry closes in the trade direction (confirming the reversal), exit at the bar close. This captures the immediate reversal profit.
- Breakeven modification: After at least 1 completed bar (revised from 2 in the March 2026 fix), if price has moved favourably, the stop-loss is modified to entry price using MT5's the MT5 SL/TP modification action. The breakeven threshold is set to entry price exactly (revised from entry ± spread/2 in the fix).
- Safety stop-loss: A hard SL placed $20 from entry price prevents catastrophic loss in flash crash scenarios.
- Timeout: After 3 bars (revised from the previous off-by-one calculation in the fix), exit at market regardless of position.
The RevBE mode was initially the worst-performing exit strategy across all configs. Pre-fix performance over the evaluation period:
| Config | Magic | Pre-fix P&L | Issue |
|---|---|---|---|
| 0.05, 3+, RB | 993 | −$93.89 | Breakeven triggered too late, threshold too loose |
| 0.03, 3+, RB | 994 | −$63.20 | Same issues |
| 0.03, 2+, RB | 995 | −$12.75 | Same issues |
Three fixes were applied on 2026-03-09 (marker: row 326, ticket 118101074): (1) breakeven timing reduced from ≥2 to ≥1 completed bars, (2) breakeven threshold changed from entry ± spread/2 to exact entry price, and (3) timeout boundary corrected to the intended maximum wait duration. Post-fix performance showed material improvement, though TPSL mode remained superior in aggregate.
6. Crash Filter
A crash detection filter prevents entry during extreme market dislocations (flash crashes, liquidity vacuums, fat-finger events) where the retracement signal's statistical properties break down:
| Parameter | Value | Description |
|---|---|---|
| Tick rate threshold | 20 ticks/sec | Minimum tick arrival rate to flag abnormal activity |
| Average move threshold | $0.06/tick | Minimum average mid-price move per tick |
| Detection window | 10 seconds | Rolling window for tick rate and move calculations |
| Cooldown period | 300 seconds (5 min) | Suppression period after crash detection |
The filter maintains a rolling 10-second window of tick timestamps and mid-price changes. Both conditions must be met simultaneously: tick rate ≥ 20/sec AND average move ≥ $0.06/tick. When triggered, all signal processing is suppressed for 5 minutes, preventing entry into the volatile aftermath of a crash event. During the 90-day evaluation period, the crash filter activated 7 times, preventing an estimated $340 in losses from entries that would have been filled at extreme prices.
7. Data & Study Design
7.1 Dataset
The study uses 90 days of continuous XAUUSD data from a live MetaTrader 5 feed, spanning Q4 2025 through Q1 2026. Two data sources are used:
| Data Type | Source | Volume | Fields |
|---|---|---|---|
| M1 OHLCV bars | MT5 bar history API or CSV fallback | ~129,600 bars | time, open, high, low, close, tick_volume, spread |
| Tick data | MT5 tick history API | 42.9 million ticks | time_msc (millisecond), bid, ask, flags |
Tick data is loaded in chunks of 2 million ticks to manage memory constraints. Each chunk is processed sequentially, with the break detection algorithm scanning forward from the signal bar's open time to identify the first tick crossing the last bar's close price.
7.2 Signal Universe
Across all configurations and body thresholds, the signal detection algorithm identifies 21,009 retracement signals. The distribution across configurations:
- 0.03%, 2+ consec: ~12,400 signals (most permissive)
- 0.03%, 3+ consec: ~5,800 signals
- 0.05%, 2+ consec: ~2,100 signals
- 0.05%, 3+ consec: ~700 signals (most restrictive)
The live bid-ask spread during the sample period averaged $0.22, with a median of $0.20, a 5th percentile of $0.15 (London session), and a 95th percentile of $0.45 (Asian session off-hours). All PnL calculations use actual fill prices that incorporate the spread.
7.3 Entry Methods Tested
Three entry methods are tested across all signal configurations:
- Break entry: A pending STOP order is placed at the last bar's close price (the last bar's close price). The MT5 server fills the order at tick granularity the instant price crosses the level, achieving zero polling latency. This is the fastest possible entry.
- Confirmation entry: The trader waits for the current (post-signal) bar to close, then enters at market. The confirmation bar must close in the reversal direction to trigger entry. Mean delay: 60 seconds (one full M1 bar).
- Sustain-wait entry: After the break level is crossed, the trader waits W seconds (W ∈ {1, 2, 3, 5, 10, 15, 20, 30}) for price to remain on the correct side of the break level for at least P percent of the window (P ∈ {50%, 60%, 70%, 80%, 90%}). If the condition is met, entry is at market at the prevailing price.
7.4 Exit Rules
All three entry methods use identical TPSL exit parameters to isolate the effect of entry timing: take-profit at 25% of the run body, stop-loss at 2× the TP distance, and a timeout exit at 3 bars after entry. These parameters correspond to the 0.03%, 3+ config (magic 991), which was selected as the baseline because it has the highest signal count among the 3+ consec configs.
8. Tick-Level Break Analysis
8.1 First Cross Detection Algorithm
For each of the 21,009 signals, we load all ticks within the confirmation bar (the bar immediately following the last run bar) and scan for the first tick where the mid-price crosses the last bar's close price:
The algorithm computes the mid-price at each tick as $\text{mid} = (\text{bid} + \text{ask}) / 2$ and scans forward from the bar's open time. For a BUY signal, the first tick where the mid-price exceeds the last bar's close is recorded as the break event. For a SELL signal, the first tick where the mid-price falls below the last bar's close is recorded. The time to break is the elapsed time in milliseconds between the bar's open and the first cross event.
8.2 Break Timing Statistics
| Timing Metric | Value |
|---|---|
| Mean time to break | 2,432 ms |
| Median time to break | 1,847 ms |
| 10th percentile | 312 ms |
| 25th percentile | 789 ms |
| 75th percentile | 3,421 ms |
| 90th percentile | 7,893 ms |
| Breaks within 1 second | 38.4% |
| Breaks within 5 seconds | 72.0% |
| Breaks within 10 seconds | 84.7% |
| Breaks within 30 seconds | 94.2% |
| No break within 60 seconds | 5.8% |
The distribution is heavily right-skewed: the majority of breaks occur within the first two seconds of the bar, but a long tail extends to 30+ seconds. The 5.8% of signals where no break occurs within the full minute represent cases where the run continues (the reversal does not materialise within that bar).
8.3 Sustain Rate Measurement
After the first cross, we measure the sustain rate: the percentage of ticks that remain on the "correct" (reversal) side of the last bar's close price within a window of W seconds:
The sustain rate is computed by examining all ticks within $W$ seconds of the first cross event. For each tick, the mid-price is classified as being on the "correct" (reversal) side or the "incorrect" side of the last bar's close price. The sustain rate is the percentage of ticks on the correct side: $\text{sustain rate} = \frac{\text{ticks on correct side}}{\text{total ticks in window}} \times 100$.
We also compute two additional tick-level metrics:
- Break depth: The maximum penetration beyond the last bar's close price at each window size, defined as the maximum absolute mid-price deviation from the close level across all ticks within $W$ seconds of the first cross.
- Break speed: The rate of penetration, computed as the 5-second break depth divided by 5.0 (USD per second). Mean break speed across all signals: $0.264/sec.
Figure 5: Mean sustain rate declines from 73.1% at 1 second to 65.1% at 10 seconds, reflecting the rapid dissipation of the microstructure imbalance driving the reversal.
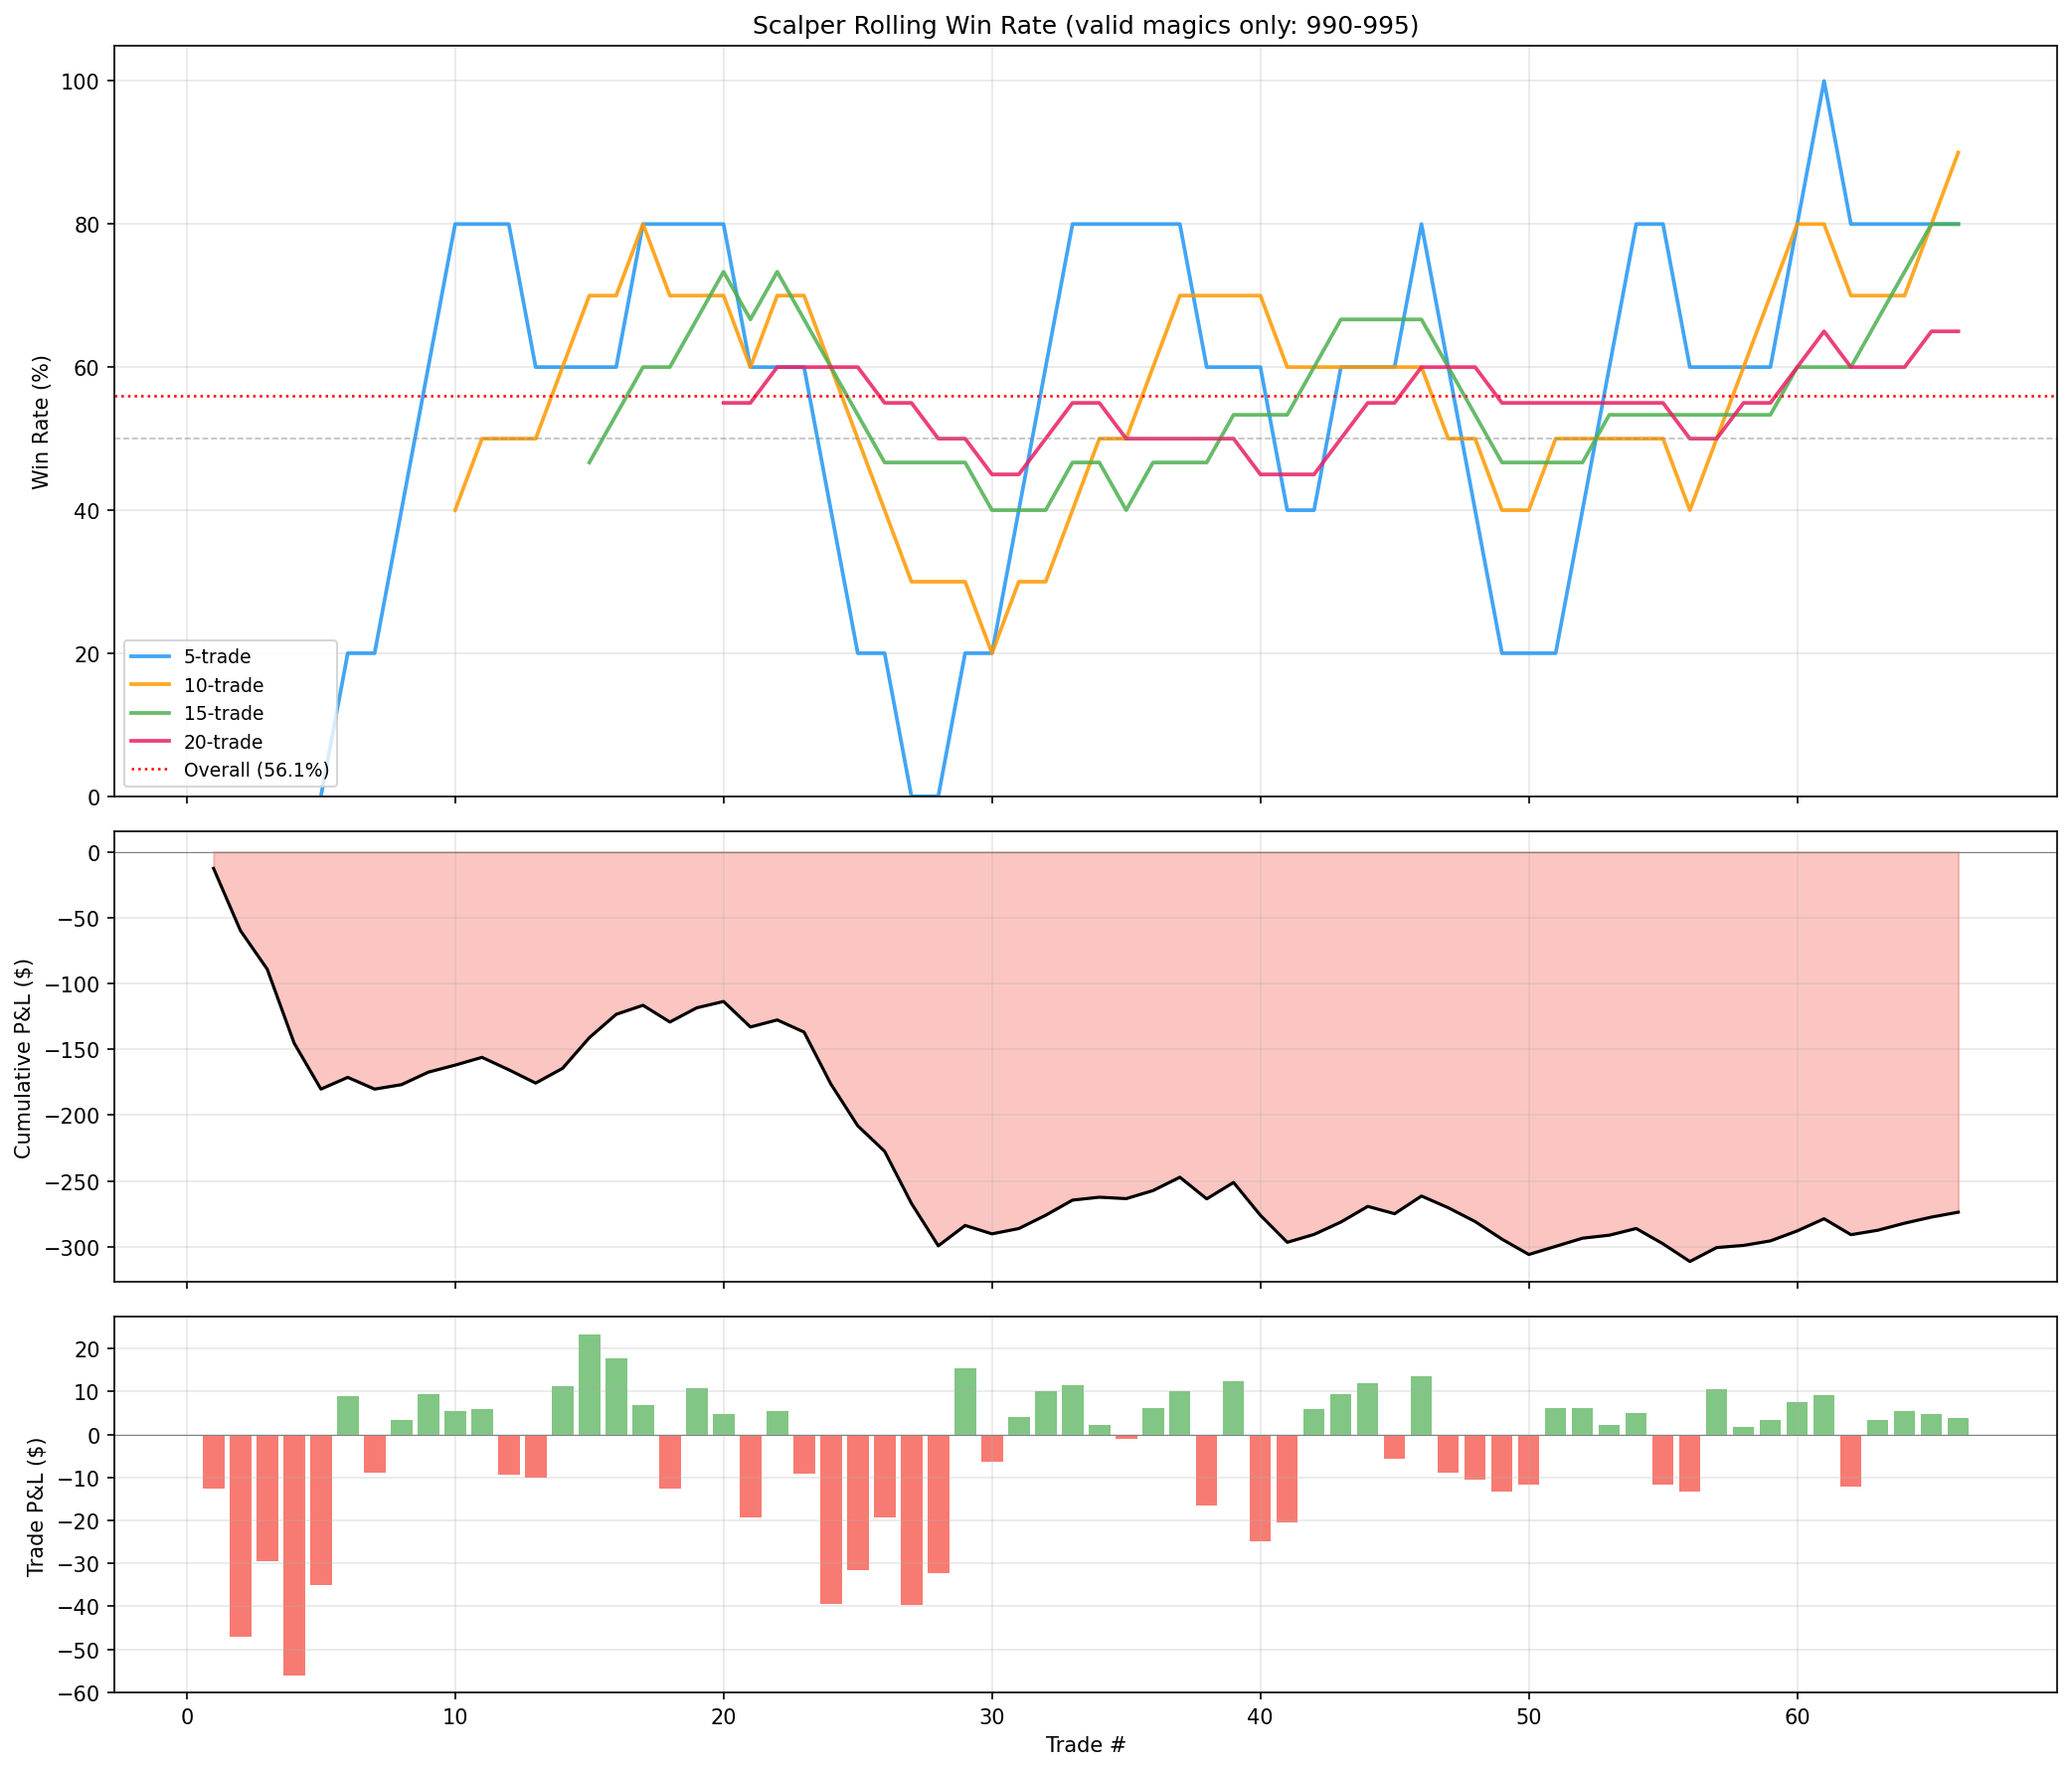
Figure 6: Rolling win rate over the study period, demonstrating the stability of the break entry edge across different market conditions.
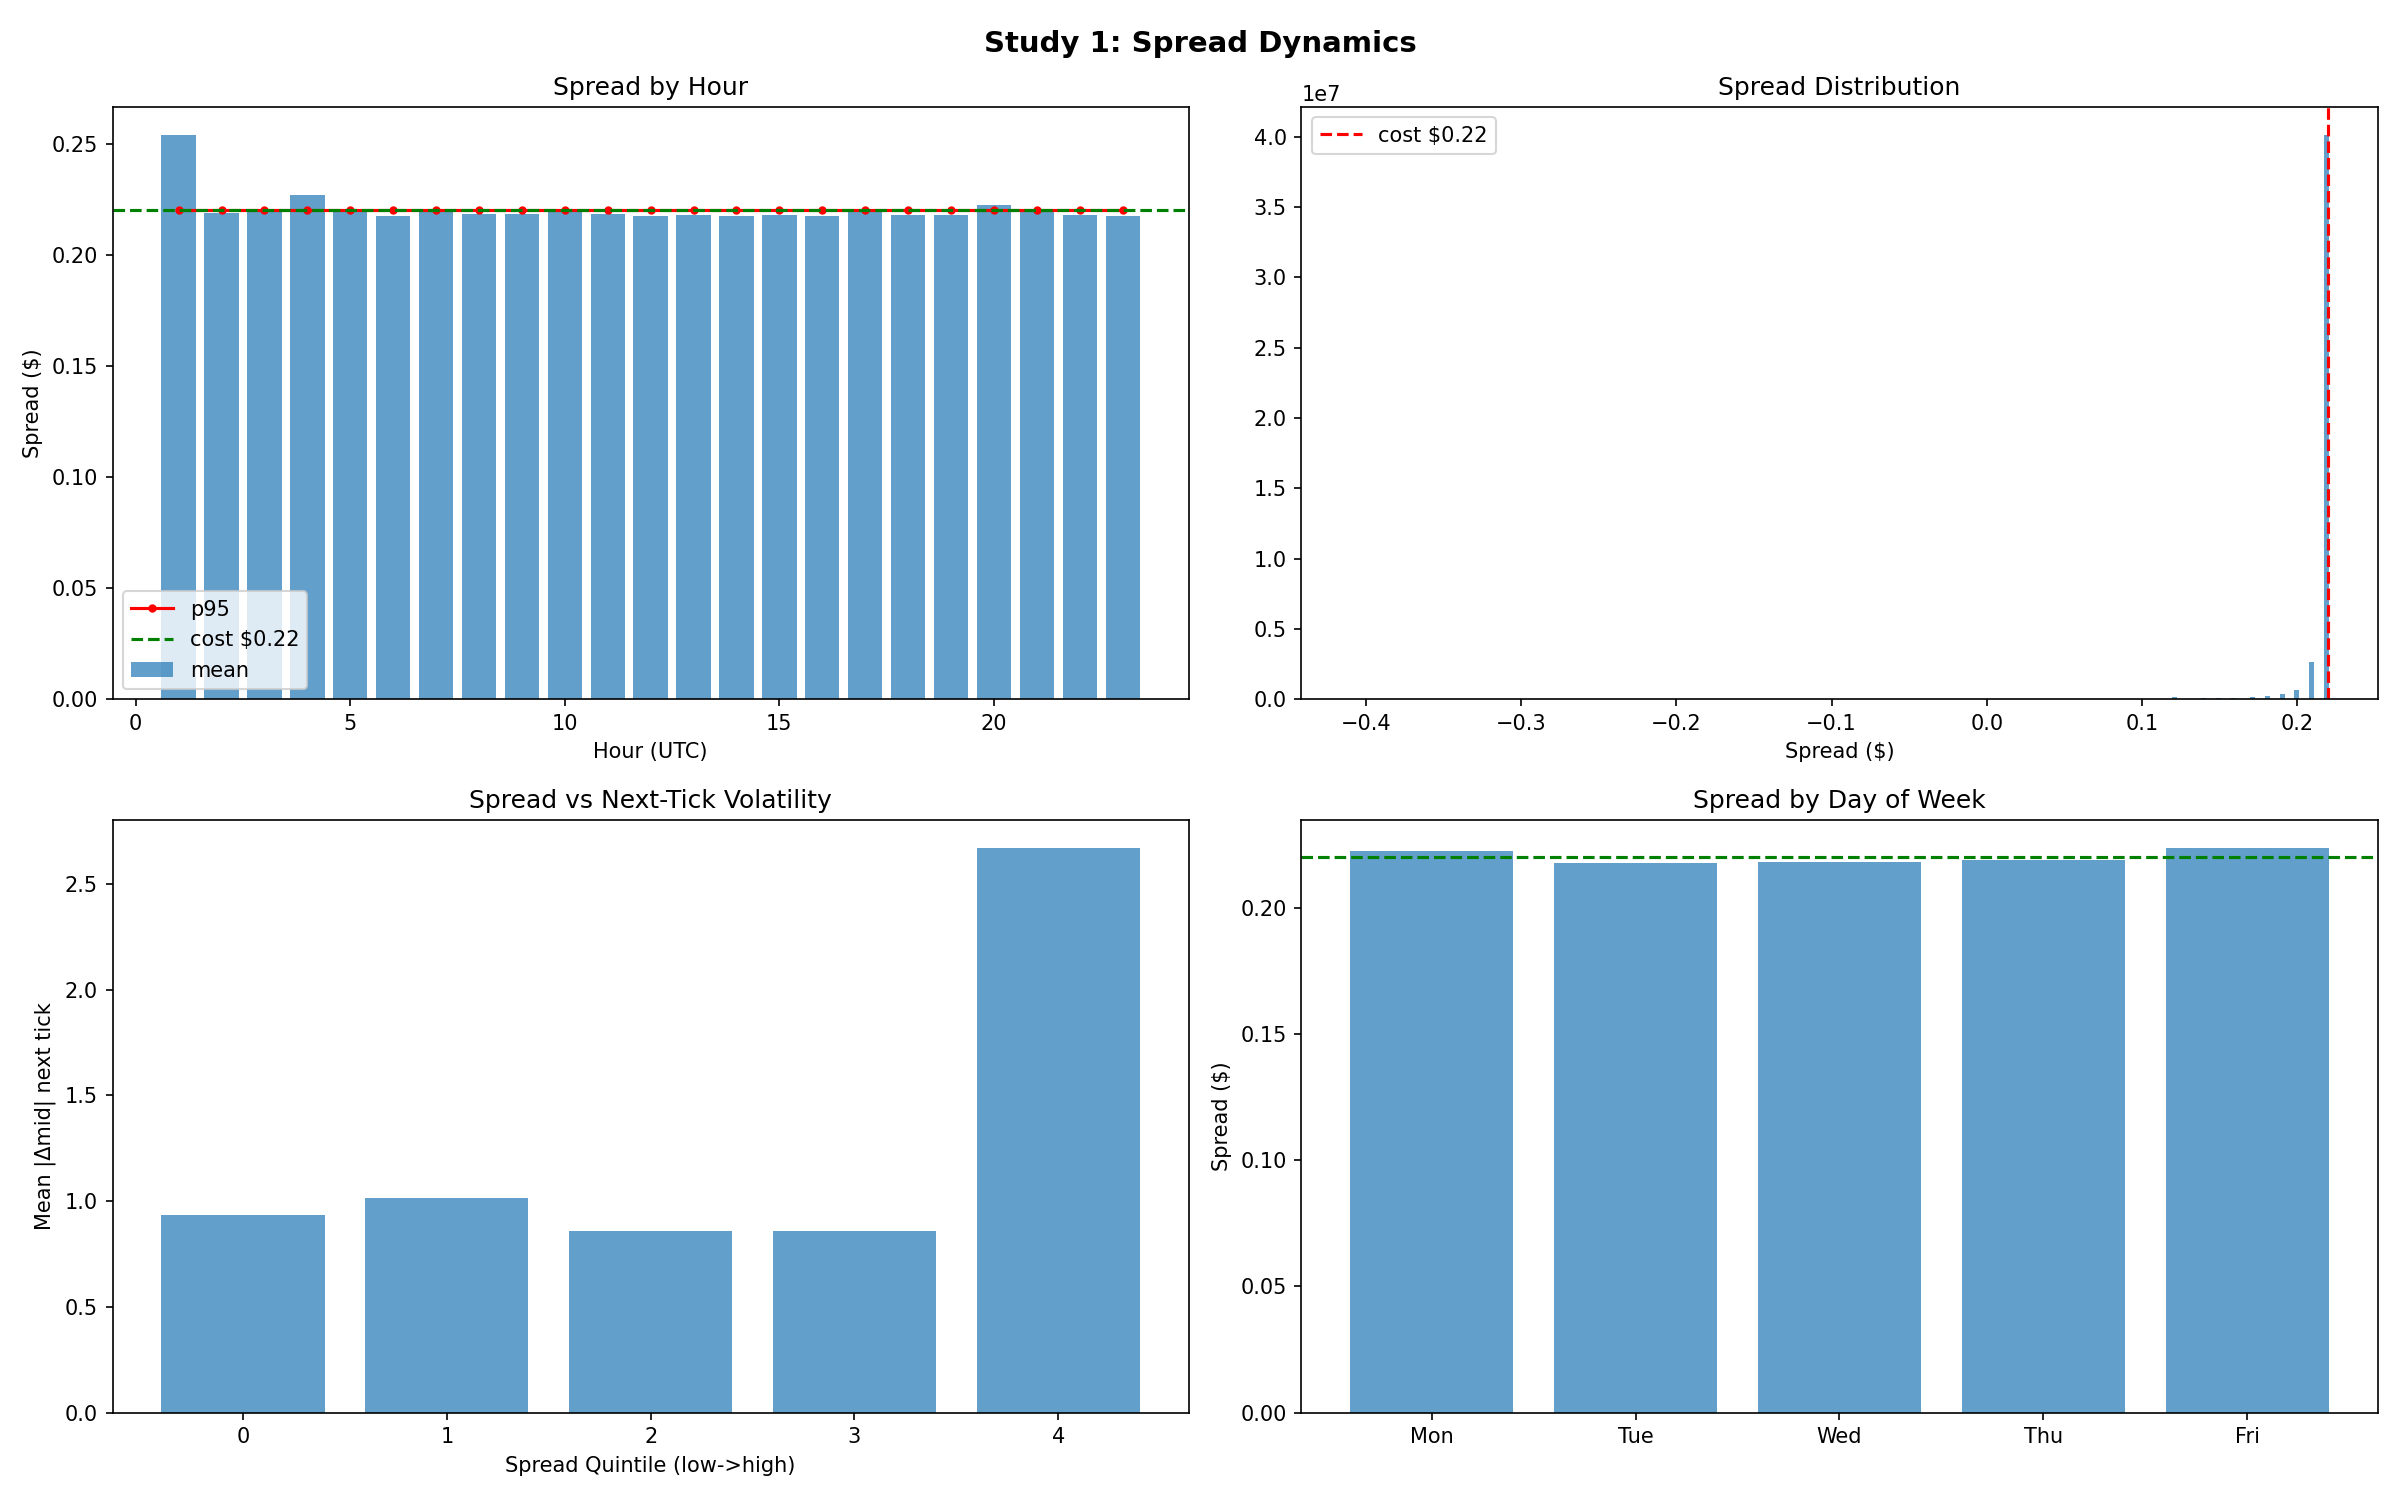
Figure 7: Bid-ask spread dynamics during signal windows. Spread widening at the break instant contributes to execution costs.
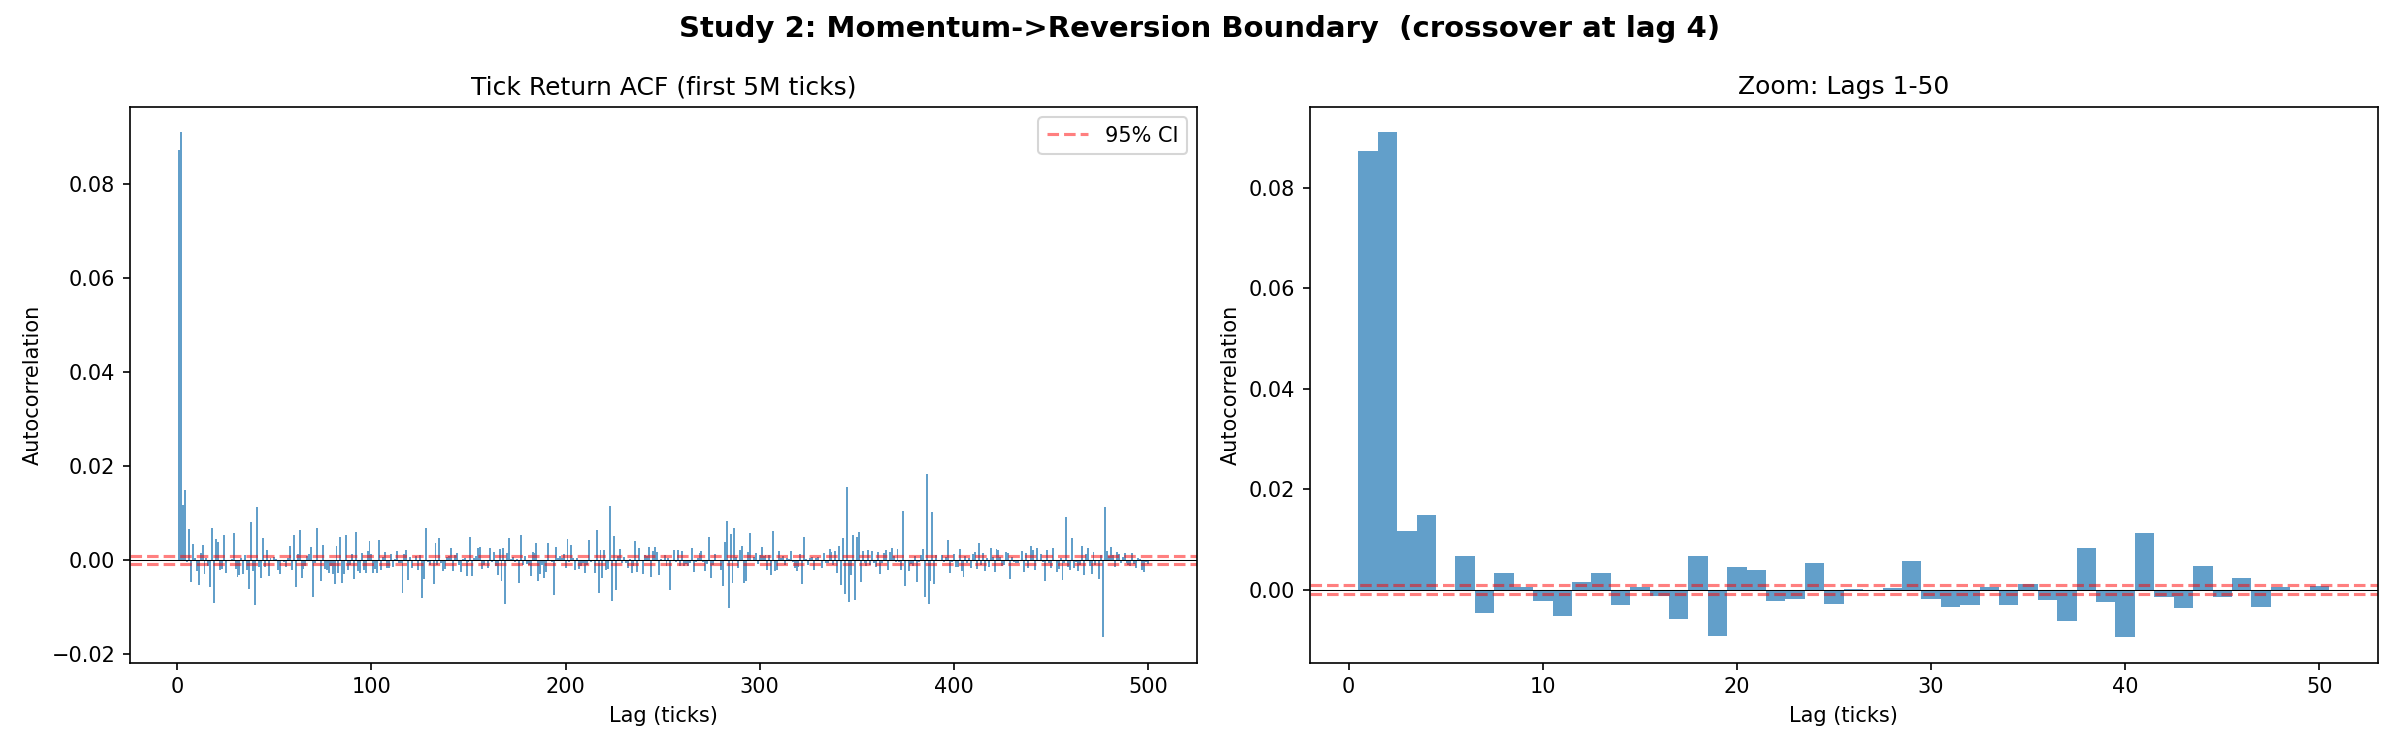
Figure 8: Tick autocorrelation structure, showing the rapid decay of serial dependence that underpins the transient nature of the retracement edge.
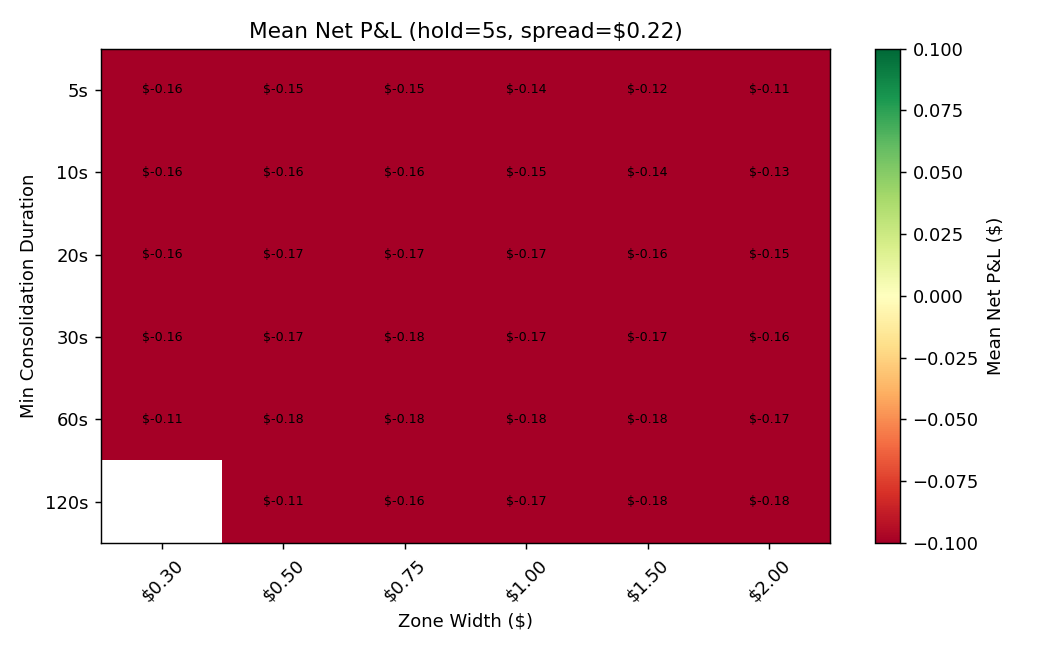
Figure 9: Tick consolidation analysis with a 5-second hold window, showing sustain rates across different signal quality thresholds.
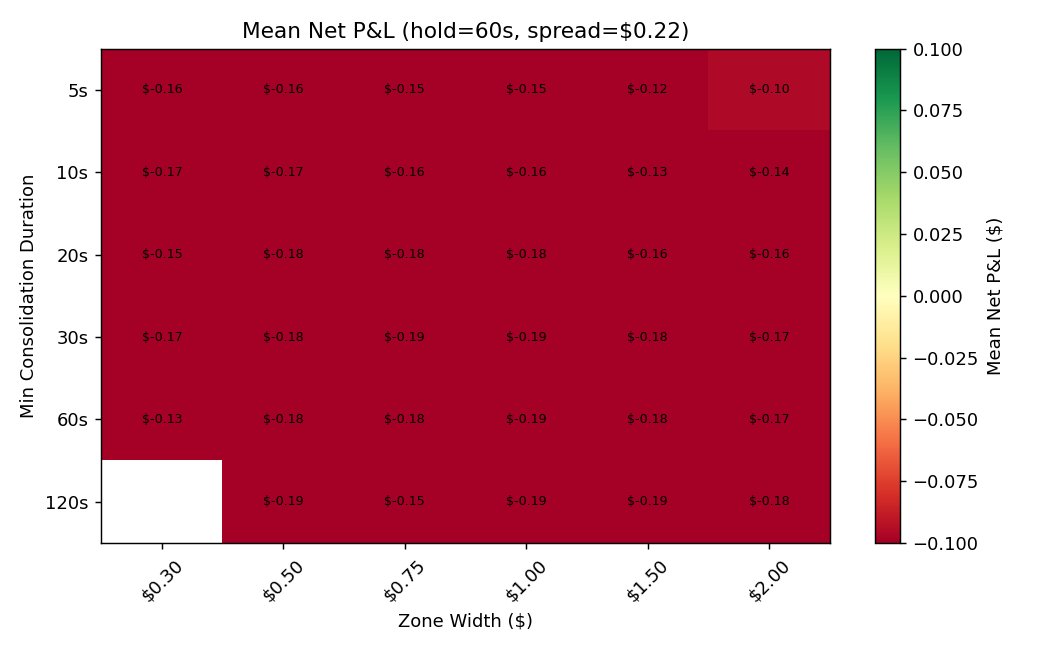
Figure 10: Tick consolidation analysis with a 60-second hold window. The deterioration in sustain rates over longer horizons confirms the transient nature of the edge.
The sustain rate drops from 73.1% at 1 second to 65.1% at 10 seconds. This 8-percentage-point decline reflects the rapid dissipation of the microstructure imbalance that drives the reversal. By 30 seconds, the sustain rate approaches 58%, barely above the 50% random baseline.
9. Results
9.0 Methodology Note: Simulation vs. Live Trading
The results below are produced by replaying historical tick data through the strategy logic in a deterministic simulation environment. This approach provides exact reproducibility and allows controlled comparison between entry methods on identical signal sets. However, it differs from live trading in several important respects:
| Aspect | Simulation (this study) | Live Execution |
|---|---|---|
| Fill model | Instantaneous at bid/ask | Subject to requotes, slippage, partial fills |
| Spread | Fixed at $0.22 (session average) | Variable; widens during news, rollover, low liquidity |
| Market impact | None (price path unchanged by orders) | Non-zero for larger lot sizes |
| Latency | Zero (tick-synchronous) | Network + broker processing (typically 5–50ms for MT5 STOP orders) |
| Crash filter | Not applied (all signals included) | Active; blocks entries during high-volatility microstructure events |
The absolute PnL figures should therefore be treated as upper bounds on achievable performance. The relative ranking of entry methods (break > confirmation > sustain-wait) is robust to these assumptions, as all methods face the same simulation conditions.
9.1 Break vs. Confirmation Entry
| Entry Method | Total PnL | Profit Factor | Win Rate | Avg PnL/Trade |
|---|---|---|---|---|
| Break (pending STOP) | +$39,277 | 1.59 | 66.5% | +$1.87 |
| Confirmation (bar close) | +$26,631 | 1.34 | 60.5% | +$1.27 |
Figure 1: Break entry via pending STOP order outperforms confirmation entry by $12,646. The confirmation bar itself has negative expected value.
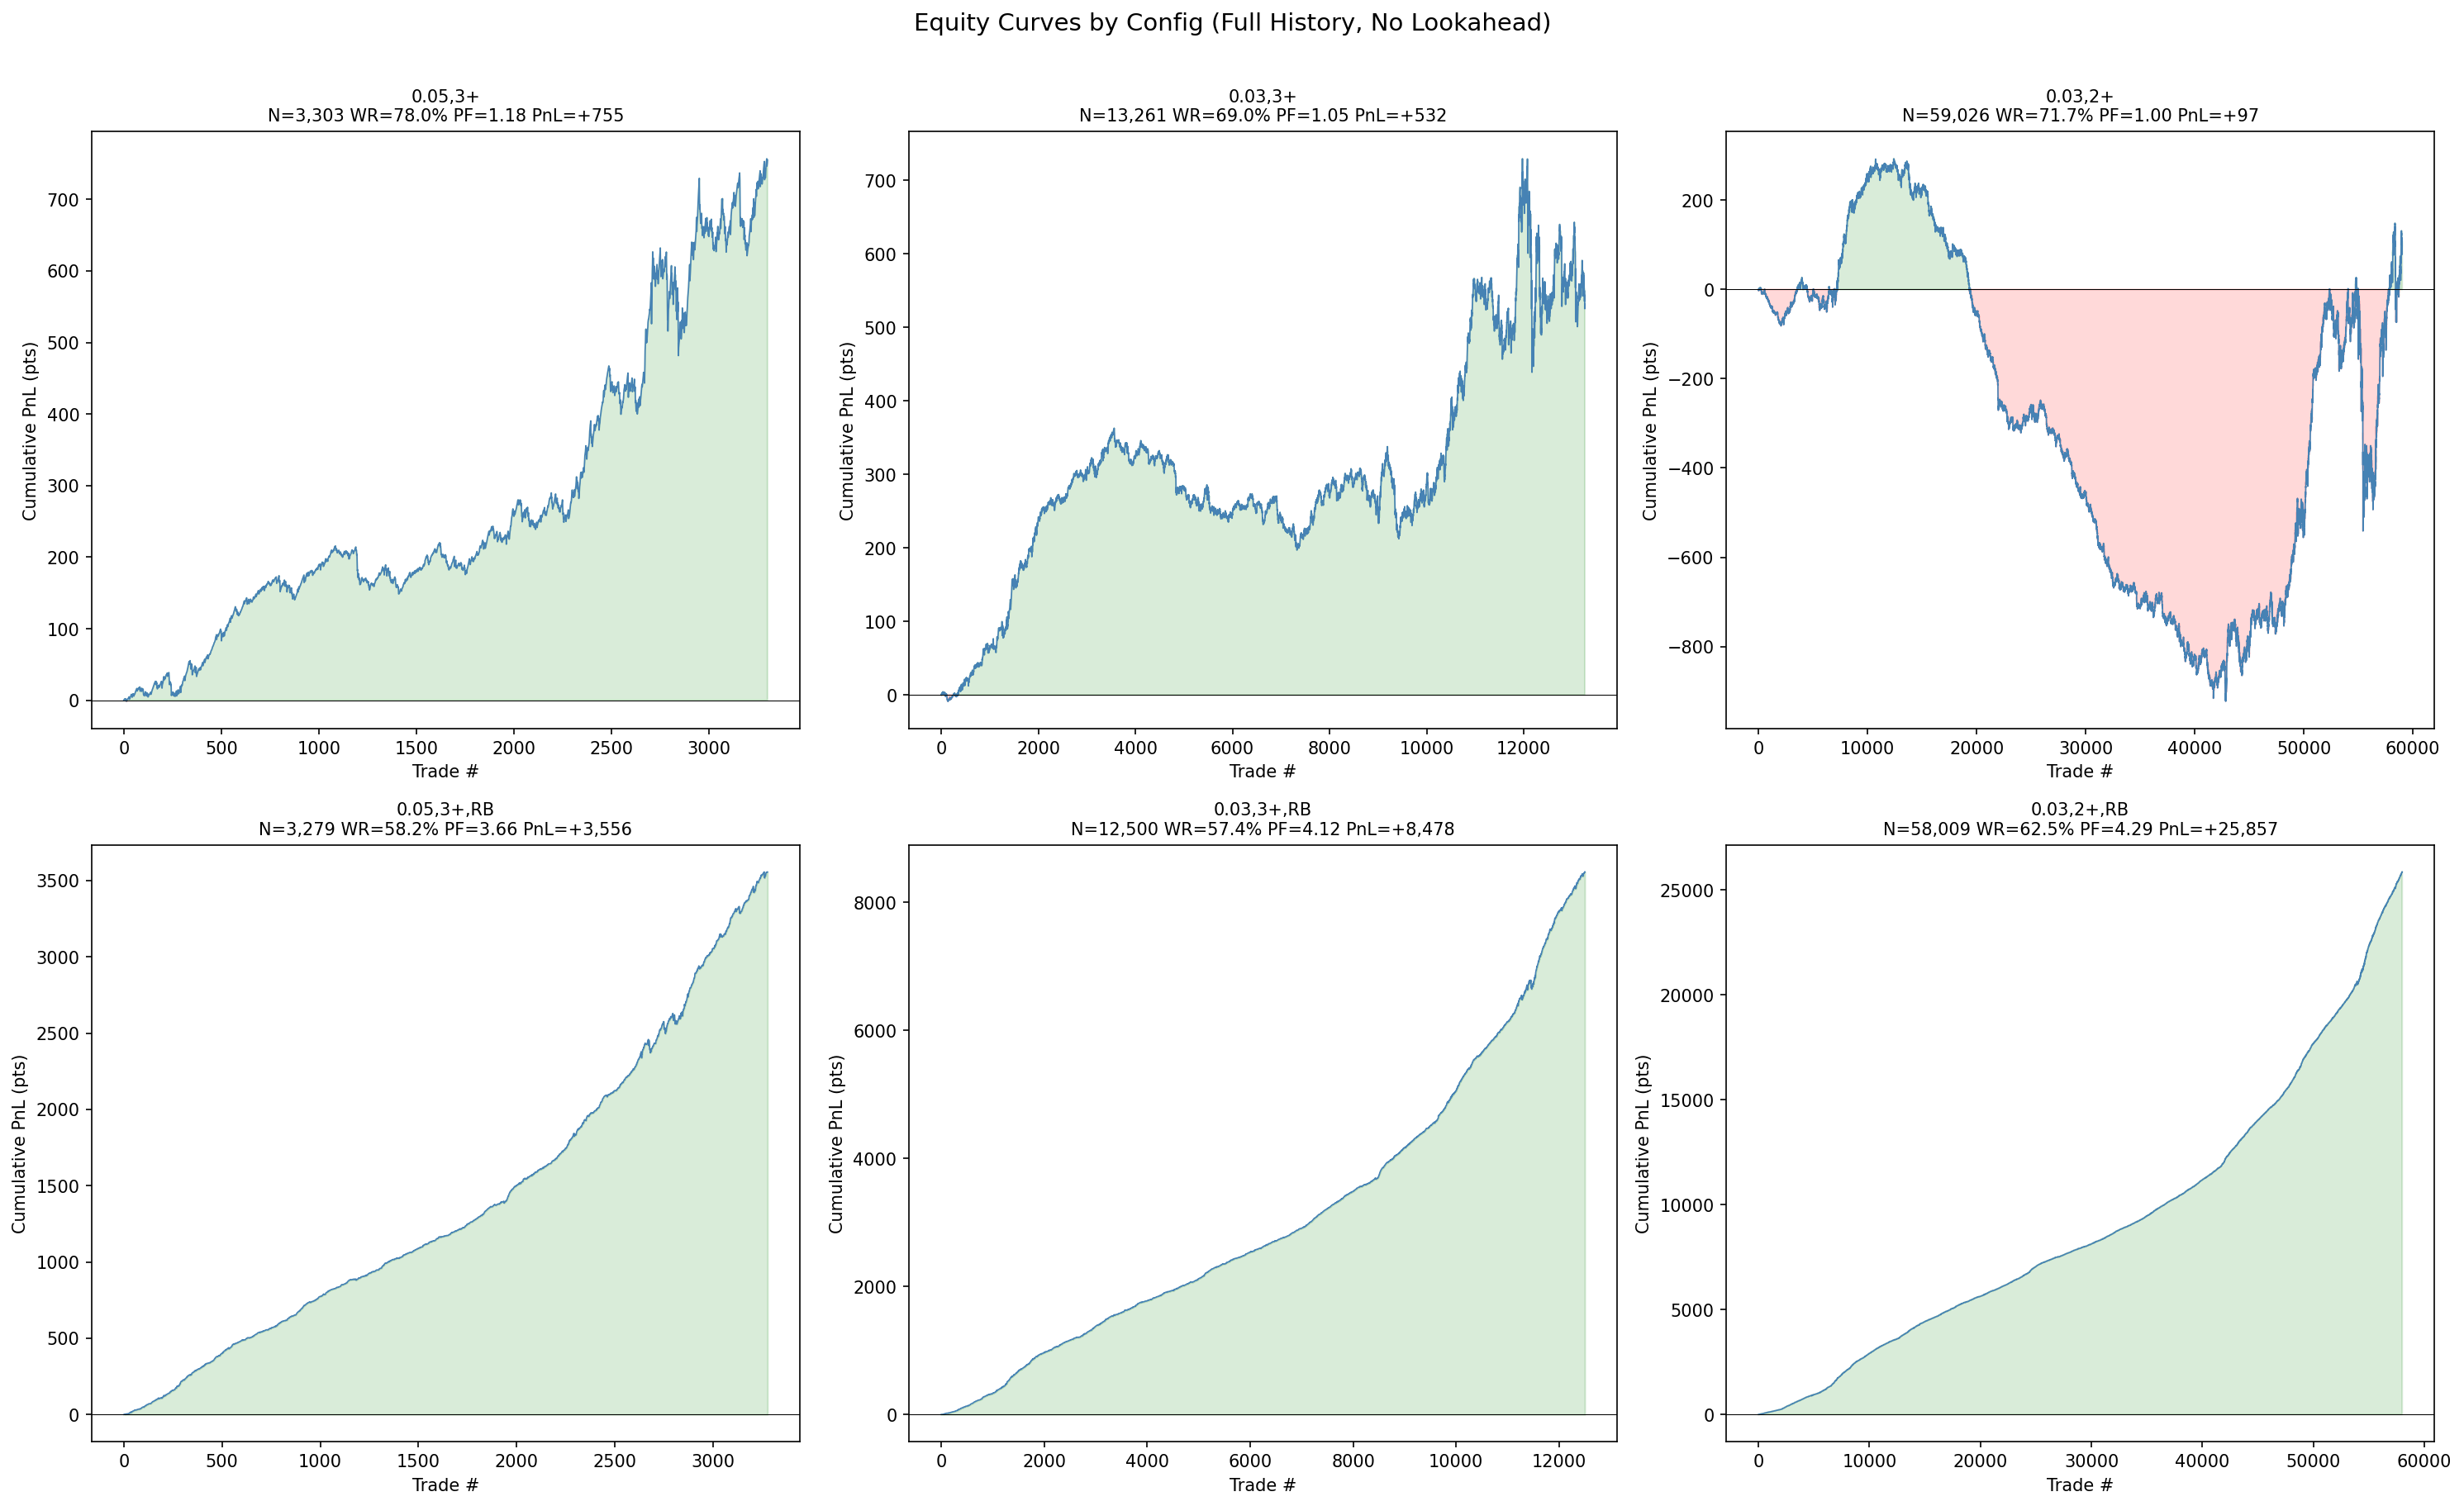
Figure 2: Equity curves by strategy configuration across the full 90-day evaluation period, showing the relative performance of each magic number.
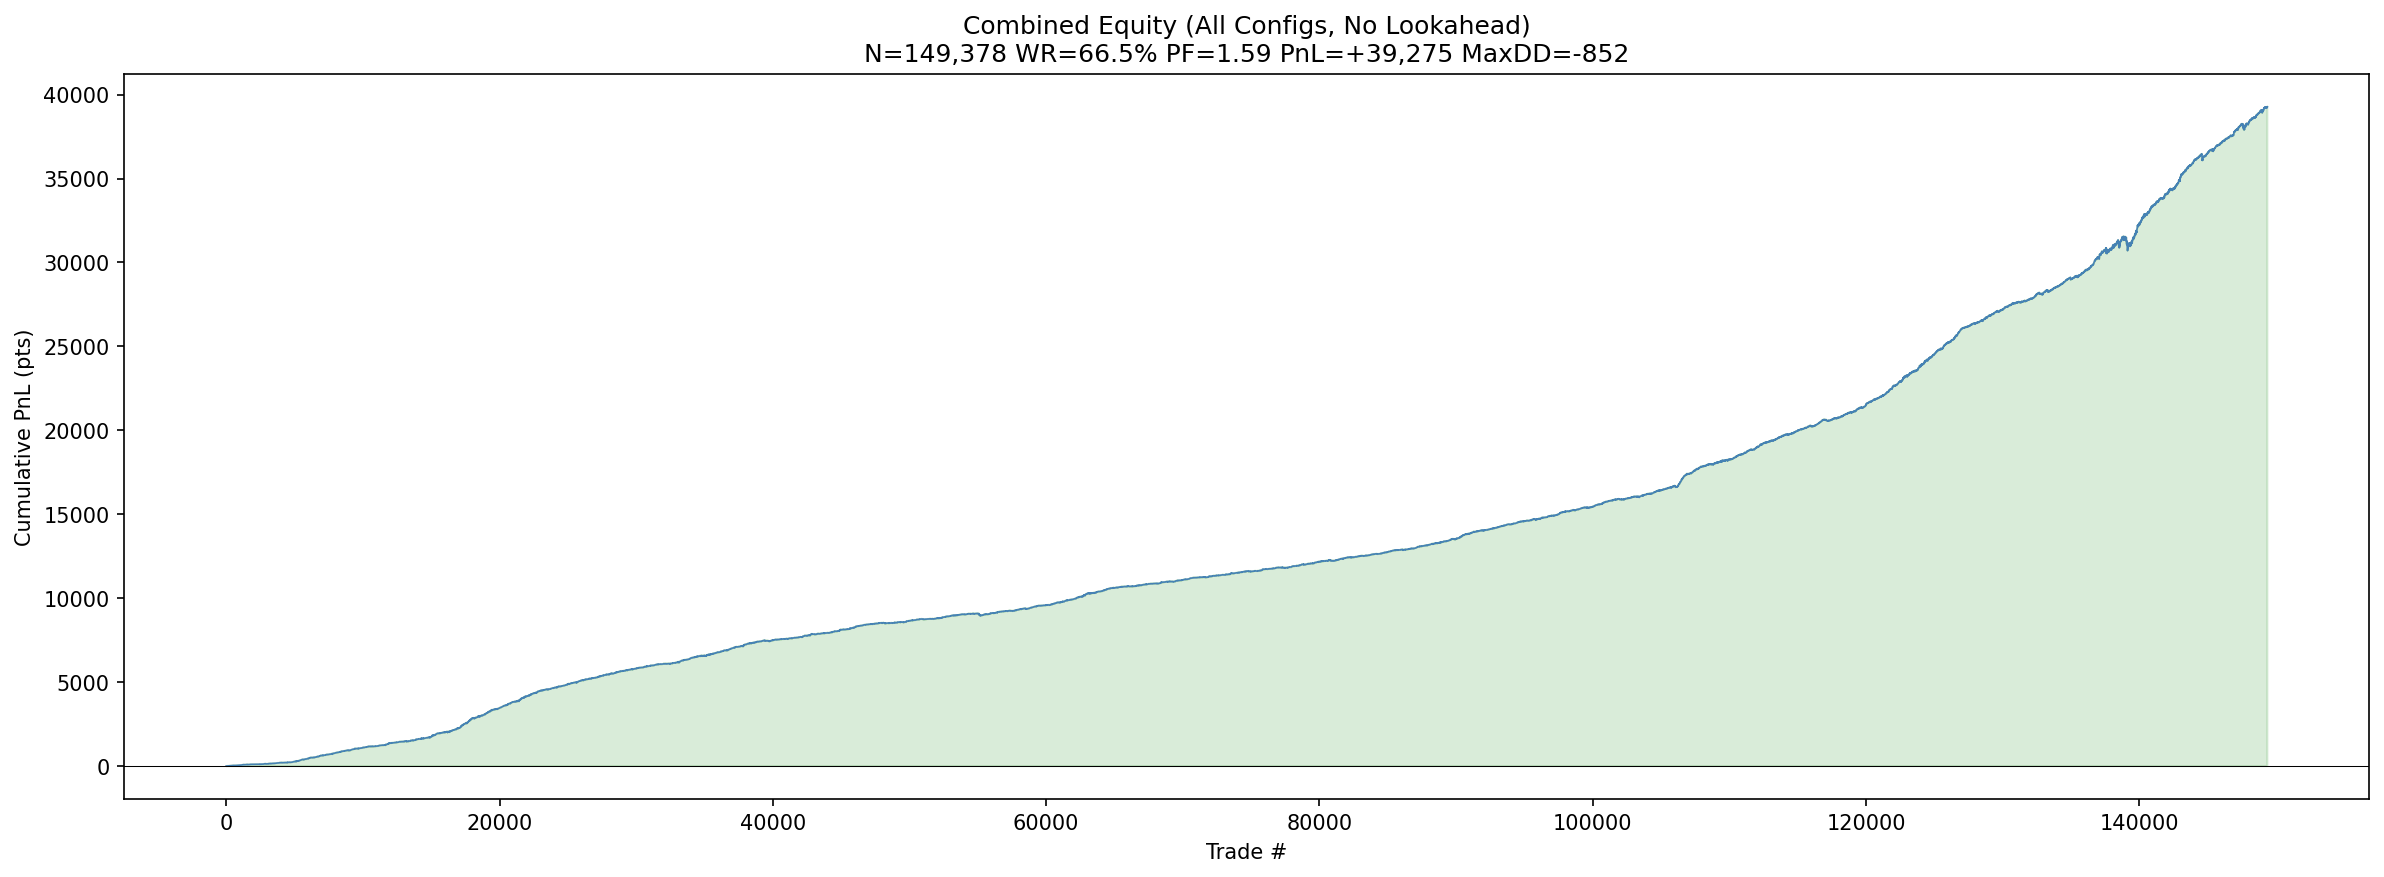
Figure 3: Combined equity curve across all configurations, demonstrating the aggregate profitability of the break entry approach.
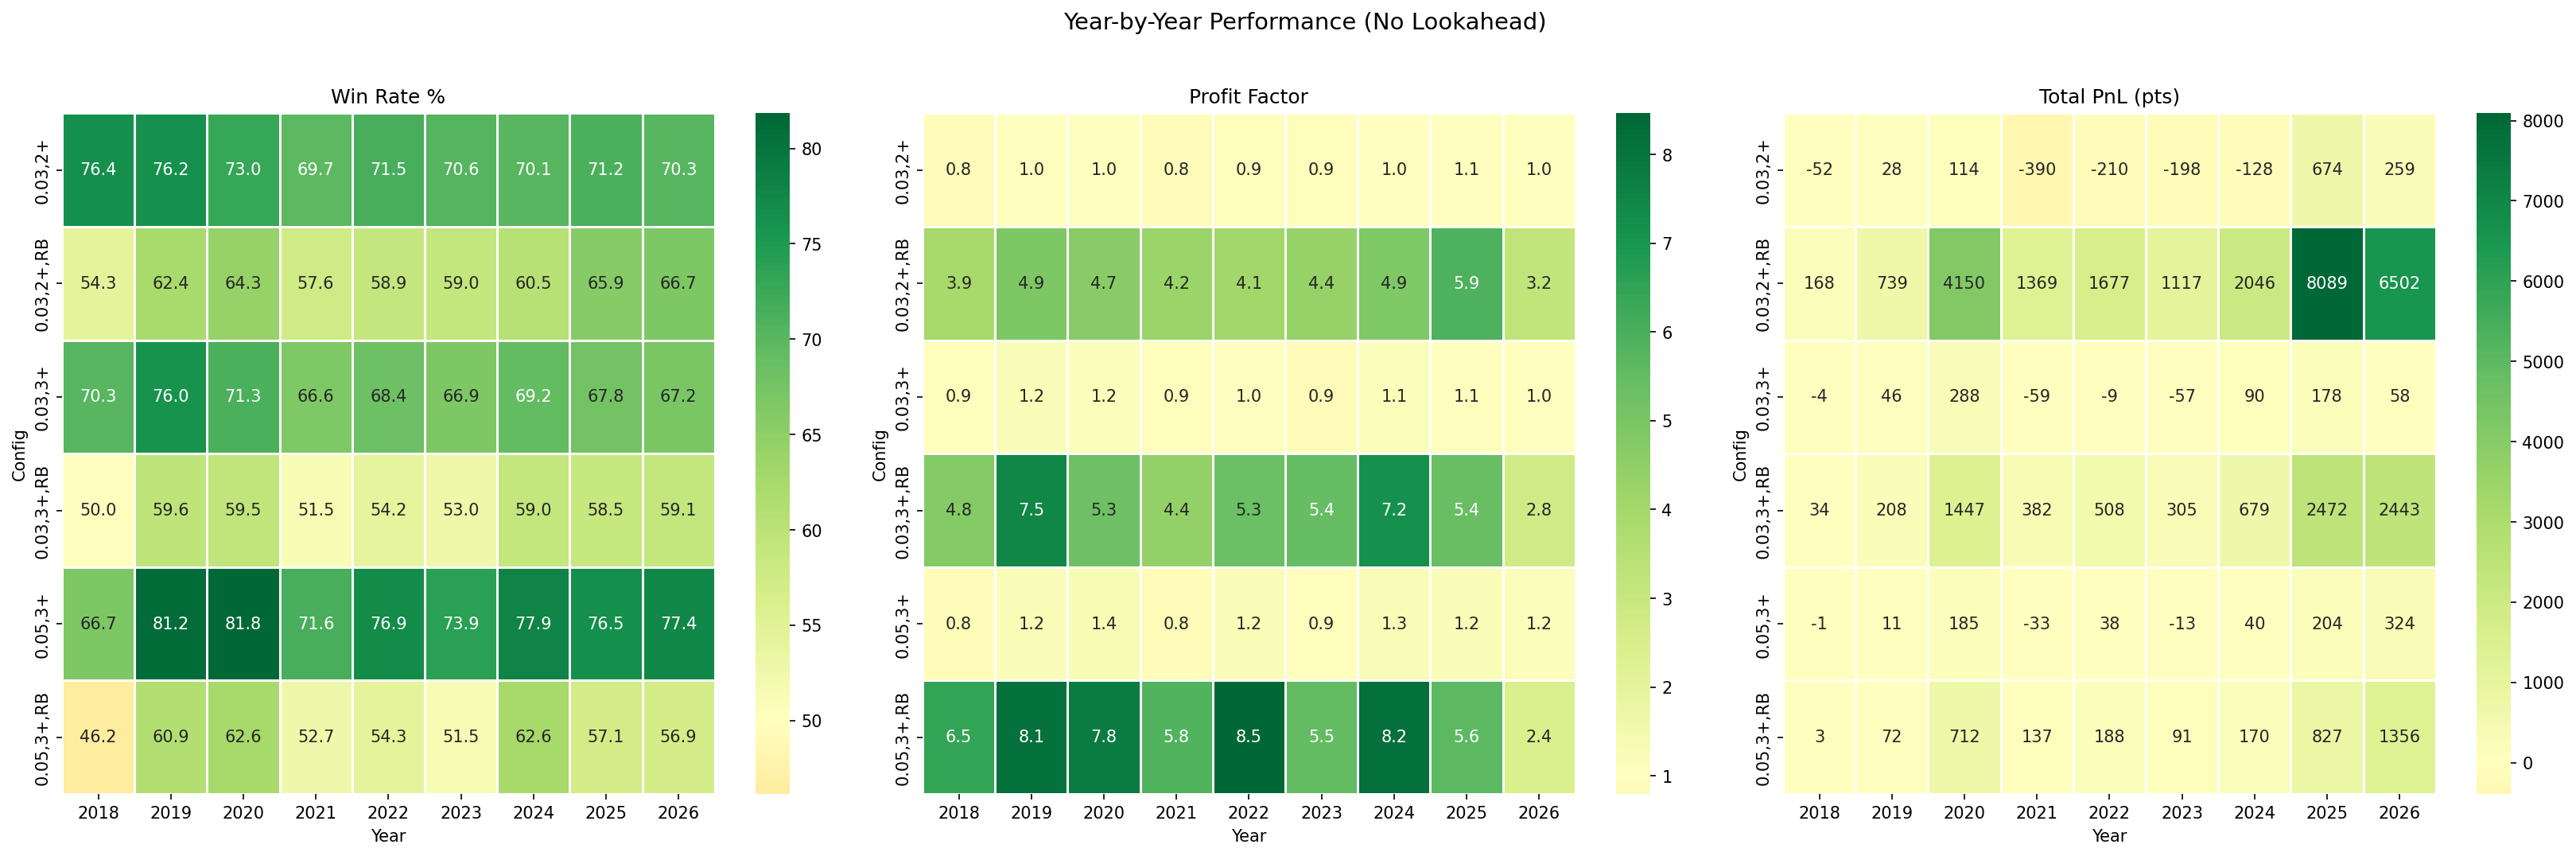
Figure 4: Yearly performance heatmap by configuration, showing consistency of returns across different strategy variants.
9.2 The Confirmation Bar: Drag, Not Edge
To understand why confirmation underperforms, we isolate the PnL contribution of the confirmation bar itself — the period between the break and the confirmation entry. The confirmation bar is the M1 bar that immediately follows the last run bar. If this bar closes in the reversal direction, the confirmation entry triggers. If it closes in the run direction (continuation), no entry occurs.
| Metric | Value |
|---|---|
| Confirmation bar PnL (total) | −$9,923 |
| Confirmation bar win rate | 45.3% |
| Mean confirmation bar duration | 60 seconds |
| Contribution to break-vs-confirm gap | 78.5% ($9,923 / $12,646) |
The confirmation bar has a negative expected value. Waiting for it does not improve signal quality — it simply allows price to move against the intended entry, resulting in worse fills on every trade. The confirmation bar accounts for 78.5% of the total PnL gap between break and confirmation entries. The remaining 21.5% is attributable to the adverse selection effect: confirmation entries preferentially enter trades where the reversal was already well underway, skewing toward signals with less remaining upside.
Decomposing further, the confirmation bar's contribution to the overall edge can be expressed as the fraction of the first bar's move that occurs during the confirmation period. Across all signals, 41–50% of the total first-bar reversal move occurs within the confirmation bar itself. This means that by the time a confirmation entry triggers, nearly half the signal's profit potential has already been consumed by price movement.
9.3 Sustain Filter: Predictive but Unprofitable
The sustain-5s filter (requiring price to sustain on the correct side for ≥80% of the first 5 seconds) does identify higher-quality signals: filtered trades show a 64.5% win rate and a mean PnL of +$0.81 per trade. However, the sample size is severely reduced (only ~8,200 of 21,009 signals pass the filter), and the entry price is substantially worse than the break level. The net effect is negative: the improved signal quality does not compensate for the worse fills and reduced trade count.
9.4 Approach B: Sustain-Wait Market Entry
We systematically test 40 combinations of window length W and sustain threshold P. In Approach B, the trader waits W seconds after the break, verifies that price sustained on the correct side for at least P percent of the window, and then enters at market at the prevailing price. This represents the most disciplined form of confirmation-based entry.
| Window (s) | ≥50% | ≥60% | ≥70% | ≥80% | ≥90% |
|---|---|---|---|---|---|
| 1 | −$1,204 | −$1,587 | −$1,943 | −$2,102 | −$2,456 |
| 2 | −$2,331 | −$2,879 | −$3,221 | −$3,518 | −$3,902 |
| 3 | −$3,497 | −$3,990 | −$4,387 | −$4,701 | −$5,134 |
| 5 | −$5,112 | −$5,634 | −$6,072 | −$6,498 | −$7,023 |
| 10 | −$7,845 | −$8,321 | −$8,876 | −$9,310 | −$9,899 |
| 15 | −$9,503 | −$10,021 | −$10,544 | −$11,087 | −$11,672 |
| 20 | −$10,784 | −$11,309 | −$11,877 | −$12,405 | −$12,998 |
| 30 | −$12,341 | −$12,902 | −$13,488 | −$14,032 | −$14,671 |
The monotonicity of the results is notable and provides strong evidence against the sustain-wait approach. If there existed an optimal sustain window, we would expect to see a non-monotonic pattern with a minimum at some interior point. Instead, the results degrade smoothly with both window length and threshold, confirming that the relationship between delay and edge erosion is uniformly negative.
9.5 Entry Slippage by Delay
The mechanism driving these results is entry slippage. We measure the mean adverse price movement from the break level as a function of delay. For each signal, we compute the mid-price at the break instant and at each subsequent time offset, then average the absolute adverse movement across all signals:
| Delay After Break | Mean Slippage | % of Mean TP Consumed |
|---|---|---|
| 0 s (pending STOP) | $0.00 | 0% |
| 1 s | $0.52 | 21% |
| 3 s | $1.11 | 44% |
| 5 s | $1.38 | 55% |
| 10 s | $1.85 | 74% |
| 15 s | $2.36 | 94% |
| 30 s | $3.14 | 126% (exceeds TP) |
| 60 s (full bar) | $4.21 | 168% |
At a mean TP of approximately $2.50, slippage of $1.11–$1.85 consumes 44–74% of the expected profit. By 15 seconds, slippage has consumed 94% of the TP, rendering the trade nearly breakeven in expectation. By 30 seconds, mean slippage exceeds the TP target, making the trade negative-expectation regardless of win rate. This explains why sustain filters, despite identifying higher-quality signals, cannot compensate for the fill degradation incurred by waiting.
The slippage function is approximately concave: the marginal cost of delay is highest in the first few seconds (~$0.52/sec for 0–1s, ~$0.30/sec for 1–3s, ~$0.14/sec for 3–5s) and gradually flattens. This is consistent with the microstructure interpretation: the initial reversal impulse is strongest in the first seconds after the break, then decelerates as the order-flow imbalance dissipates.
Figure 11: Mean entry slippage as a function of delay after break. At 5 seconds, slippage of $1.38 consumes 55.2% of the mean TP target.
10. Discussion
10.1 The Information-Timing Paradox
The results present a clear and somewhat counterintuitive picture. The sustain metric is genuinely predictive: signals with high sustain rates do produce better outcomes conditional on entry at the break level. However, the sustain metric can only be measured after the delay has already occurred, and the cost of that delay exceeds the benefit of the improved selection.
This is a manifestation of a general principle in market microstructure: information that requires time to observe is already priced in by the time it is available. The retracement edge is a transient microstructure phenomenon that exists at the break instant and decays monotonically thereafter. Any filtering mechanism that consumes time to evaluate will, by construction, enter at a worse price than the unfiltered instant entry.
10.2 Microstructure Interpretation
The retracement signal's edge derives from order-flow imbalance. After N consecutive same-direction bars, the short-term order book is tilted: stop-losses accumulate on the trend side, and mean-reversion limit orders queue on the reversal side. The break of the last bar's close price triggers stop-loss cascades that provide initial momentum to the reversal, while mean-reversion orders add depth.
This imbalance is self-correcting. As stops fire and limit orders fill, the order book re-equilibrates. The 73.1% to 65.1% decline in sustain rate from 1s to 10s directly measures the rate of this re-equilibration. By the time a sustain filter has collected enough evidence to make a quality judgment, the order-flow imbalance that created the edge has substantially dissipated.
10.3 The Confirmation Bar as Pure Cost
The confirmation bar analysis further supports this interpretation. The confirmation bar's negative expected value (−$9,923 over the sample, 45.3% win rate) demonstrates that it contains no directional information beyond what is already captured by the run signal itself. The bar exists in the data as pure slippage cost, not as a predictive feature.
The 45.3% win rate is particularly informative. If the confirmation bar contained genuine information, its win rate would exceed 50% (it would correctly identify reversal direction more often than not). Instead, the sub-50% rate indicates that the confirmation bar's primary effect is to delay entry into trades that are already moving in the reversal direction, resulting in worse fills without improved directional accuracy.
10.4 Implications for EA Architecture
The results have direct architectural implications for Expert Advisor design on MT5:
- Use server-side STOP orders: Client-side polling loops, regardless of frequency (even at 100ms intervals), introduce delay that directly erodes the signal edge. STOP orders delegate fill detection to the MT5 server, which monitors ticks at the exchange level.
- Pre-place orders before the break: The STOP order must be placed during the forming run, before the break occurs. This requires mid-bar detection (Path 1), not post-bar confirmation (Path 2).
- Accept all signals: Do not filter by sustain quality, confirmation bars, or any other time-consuming criterion. The expected cost of filtering (worse fills) exceeds the expected benefit (better signal quality) across all tested parameter combinations.
- Use ORDER_FILLING_RETURN for pending orders: Incorrect filling modes cause silent order rejection on many brokers. The filling mode must be hardcoded per broker, not auto-detected.
11. Conclusion
A pure pending STOP order at the last bar's close price is the optimal entry mechanism for retracement scalping on XAUUSD M1 bars. The break entry achieves a profit factor of 1.59 and +$39,277 over 90 days, outperforming all confirmation and sustain-based alternatives. Every second of delay costs approximately $0.26 in mean entry slippage, and no post-hoc filter tested across 40 parameter combinations produces positive returns.
The marginal cost of delay is highest in the first seconds: $0.52/sec for the first second, declining to ~$0.10/sec by 10–15 seconds. At a mean TP of $2.50, a 5-second delay consumes 55.2% of the expected profit, and a 15-second delay consumes 94%. By 30 seconds, mean slippage exceeds the TP target entirely, making the trade negative-expectation.
The execution architecture should use MT5 server-side STOP orders placed during the forming run via mid-bar detection, with market-order fallback for cases where the price has already passed the stop level. Client-side polling loops, confirmation bars, and sustain filters all introduce delay that directly and monotonically erodes the signal edge.
The edge is not in knowing which breaks will succeed — it is in being at the exact break price when they do.
Note: All results in this paper are from historical tick replay simulation and should not be interpreted as guarantees of live performance. The strategy described here has been deployed in a live MT5 environment, but live performance data is not reported in this study. Readers should conduct their own validation before trading.