Geopolitical Risk and Gold: An Empirical Study
Abstract
Using the Caldara-Iacoviello Geopolitical Risk Index matched to XAUUSD M1 data (2018-2026 overlap, ~94 monthly observations), we test whether GPR predicts gold returns. GPR level regimes condition return distributions (higher volatility and positive skew in high-GPR months), but directional predictive power is weak. The signal operates at monthly frequency, too slow for intraday trading but potentially useful as a regime filter.
1. Introduction
Gold sits in a unique spot in global financial markets. Unlike equities or fixed income, gold generates no cash flows, pays no dividends, and has no earnings to discount. Its value comes almost entirely from its role as a store of value, a monetary reserve asset, and (critically for this study) a safe-haven instrument that attracts capital during periods of elevated geopolitical uncertainty. Whether geopolitical risk systematically drives gold returns matters both for portfolio construction and for understanding how tail-risk expectations get priced across asset classes.
The challenge in studying geopolitical risk has always been measurement. Unlike inflation, interest rates, or volatility, geopolitical risk is latent. You can't observe it from market prices. Caldara and Iacoviello (2022) addressed this by constructing the Geopolitical Risk (GPR) index, a text-based measure derived from automated searches of major newspaper archives. The index counts the share of articles discussing geopolitical tensions, military escalations, wars, and terrorist threats, producing a monthly time series from 1985 to the present. The GPR index has since become the standard academic measure of geopolitical risk, cited in over 2,000 studies across economics and finance.
This paper uses the Caldara-Iacoviello GPR index to examine the relationship between geopolitical risk and gold returns across the GPR series (490 months from 1985) matched to our XAUUSD M1 data (2018-2026, giving roughly 94 overlapping monthly observations). We test whether GPR levels condition gold return distributions, whether GPR changes predict forward gold returns, and whether the relationship is stable across decades or regime-dependent. We extend the analysis to intraday frequency using a live GPR sentiment proxy, testing predictive power at the 1-minute to 60-minute horizon with walk-forward logistic regression and proper train/test splits.
The main finding is counterintuitive: geopolitical risk clearly conditions gold return distributions (high-GPR months show elevated volatility, positive skew, and modestly higher mean returns) but the directional predictive power is negligible. The GPR index tells you about the environment gold is trading in, but not about the direction gold will move. This has direct implications for how geopolitical risk should be incorporated into systematic trading models: as a regime filter or volatility scaling input, not as a directional signal.
2. Literature and Context
The academic literature on gold as a safe haven is extensive. Baur and Lucey (2010) drew the distinction between gold as a hedge (negatively correlated with stocks on average) and a safe haven (negatively correlated during extreme market stress). Using a regime-switching framework on US, UK, and German stock markets, they found that gold acts as a safe haven for stocks but not for bonds, and that the safe-haven property is short-lived, typically lasting around 15 trading days after a shock. Baur and McDermott (2010) extended this to a broader set of international equity markets, confirming gold's safe-haven role for developed-market equities but finding weaker evidence for emerging markets.
Reboredo (2013) examined whether gold hedges the US dollar, finding that gold serves as an effective hedge and weak safe haven against dollar depreciation but not appreciation, with copula analysis revealing asymmetric tail dependence. This dollar-gold nexus matters for our study because geopolitical shocks often coincide with dollar movements, creating a potential confounding channel.
The direct link between geopolitical risk and gold was enabled by Caldara and Iacoviello (2022), whose GPR index provided the first systematic, newspaper-based measure of geopolitical risk with consistent monthly coverage from 1985. Their original paper showed that GPR shocks reduce real activity, lower stock returns, and increase capital flows to safe assets. But the magnitude and persistence of the gold response to GPR shocks remained an open question, particularly at horizons relevant to systematic trading.
This study extends the existing literature in three ways. First, we use the full GPR time series through early 2026, capturing recent geopolitical episodes including the Russia-Ukraine conflict (2022 to present), the Hamas-Israel conflict (2023 to present), and ongoing US-China tensions. Second, we test the relationship not only at the monthly level but also at intraday horizons (1 to 60 minutes) using a high-frequency GPR sentiment proxy, with proper walk-forward methodology to avoid look-ahead bias. Third, we run formal predictive power assessments using logistic regression, ROC AUC, and ablation tests that isolate the incremental information content of GPR features beyond what price-based features already capture.
3. Data
3.1 Geopolitical Risk Index
The Caldara-Iacoviello GPR index is constructed from automated text searches of 10 major newspapers (including the Chicago Tribune, The Daily Telegraph, Financial Times, The Globe and Mail, The Guardian, Los Angeles Times, The New York Times, USA Today, The Wall Street Journal, and The Washington Post). For each month, the index computes the share of articles containing words related to geopolitical tensions, grouped into eight threat categories: war threats, peace threats, military buildups, nuclear threats, terrorist threats, beginning of war, escalation of war, and terrorist acts. The index is normalised to a mean of 100 over the 2000-2009 baseline period.
We use the monthly GPR series from January 1985 through early 2026. The overlap with our XAUUSD M1 data runs from mid-2018 to early 2026, giving roughly 94 matched monthly observations. The index has substantial right skew: the median is about 85, but values exceeding 300 occur during major events (the Gulf War in 1990-91, the September 11 attacks in 2001, the Iraq War in 2003, and the Russia-Ukraine invasion in February 2022). We compute several derived features from the raw index: month-over-month (MoM) absolute change, MoM percentage change, a rolling z-score, and percentile rank across the full history.
3.2 Gold Price Data
XAUUSD prices are sourced from M1 (one-minute) bars and resampled to monthly frequency. For each calendar month, we compute the open (first close in the month), close (last close), high (maximum close), low (minimum close), and total bar count. Monthly returns are computed as simple percentage changes from the monthly open to the monthly close. Forward returns at 1-month, 3-month, and 6-month horizons are computed from the monthly close price. The gold data overlaps with the GPR index from 2018 through early 2026, yielding roughly 96 months for the joint monthly analysis.
3.3 Intraday GPR Proxy
For the intraday predictive tests, we use a live GPR sentiment proxy (`gpr_live_100`) that updates at higher than monthly frequency, aligned to XAUUSD M1 bars via backward asof merge with a 30-minute tolerance. This produces roughly 13,700 aligned minute-bar observations. The intraday GPR signal is transformed into log-GPR, 1-bar and 5-bar log differences, a 60-bar rolling z-score, and combined with lagged returns as features in a logistic regression framework.
4. Methodology
4.1 GPR Level Regimes
We partition the sample into three regimes based on the percentile rank of the GPR index within its own history:
- Low GPR: below the 25th percentile (GPR is historically subdued)
- Normal GPR: between the 25th and 75th percentile
- High GPR: above the 75th percentile (elevated geopolitical risk)
We also flag Spike months as those exceeding the 95th percentile, corresponding to acute geopolitical crises. For each regime, we compute the distribution of gold returns (same-month, 1-month forward, and 3-month forward), including mean, median, standard deviation, win rate (percentage of months with positive returns), and annualised Sharpe ratio.
4.2 MoM Change Quintiles
Rather than using the GPR level, which is persistent, we also look at GPR changes, the month-over-month percentage change in the index. These are divided into quintiles:
- Q1 (Big Drop): largest GPR declines, geopolitical tensions easing
- Q2 (Small Drop): modest GPR declines
- Q3 (Neutral): minimal GPR change
- Q4 (Small Spike): modest GPR increases
- Q5 (Big Spike): largest GPR increases, acute geopolitical escalation
For each quintile, we compute the same-month gold return, forward returns at 1-month, 3-month, and 6-month horizons, and win rates at each horizon. The quintile approach is distribution-free and robust to outliers in the GPR change series.
4.3 Predictive Testing Framework
To assess whether GPR has genuine predictive power for gold direction, we use two complementary approaches:
Spearman rank correlation: We compute the Spearman correlation between GPR features (level and MoM change) and gold returns at various horizons. Spearman is preferred over Pearson because it doesn't assume linearity and is robust to outliers in both variables.
Walk-forward logistic regression: We fit a logistic regression on a 70% training set (chronologically first) and evaluate on the remaining 30% (chronologically last), ensuring no look-ahead bias. The model predicts the probability that the forward return is positive. Features include log-GPR, 1-bar and 5-bar GPR log differences, a 60-bar rolling GPR z-score, and the lagged 1-bar return. Performance is measured by ROC AUC (discrimination), accuracy, balanced accuracy, and a binomial test for whether accuracy exceeds 50%.
Ablation test: To isolate GPR's incremental value, we compare a baseline model using only price-based features (lagged returns at 1, 5, and 15 bars, plus 15-bar rolling volatility) against an augmented model that adds GPR features (log-GPR, 1-bar and 5-bar GPR log differences, GPR z-score). The AUC difference between the two models quantifies the marginal information content of GPR.
4.4 Spike-Conditional Analysis
Large GPR spikes are rare events. To test whether extreme GPR increases predict gold direction, we isolate observations where the 1-bar GPR log difference exceeds the 95th or 99th percentile of its own distribution. For these spike events, we compute the forward gold return at horizons from 1 to 60 minutes, the win rate, and a binomial test against the null that the win rate equals 50%.
4.5 Lag Sweep
The relationship between GPR changes and gold returns may operate with a delay. We test this by computing the Spearman correlation between the current GPR log difference and future gold returns at lags of 1, 2, 3, 5, 10, 15, 20, 30, 45, 60, 90, and 120 minutes. We also compute the univariate AUC of the GPR log difference as a classifier for the sign of the future return at each lag.
5. Results: GPR Level and Gold Returns
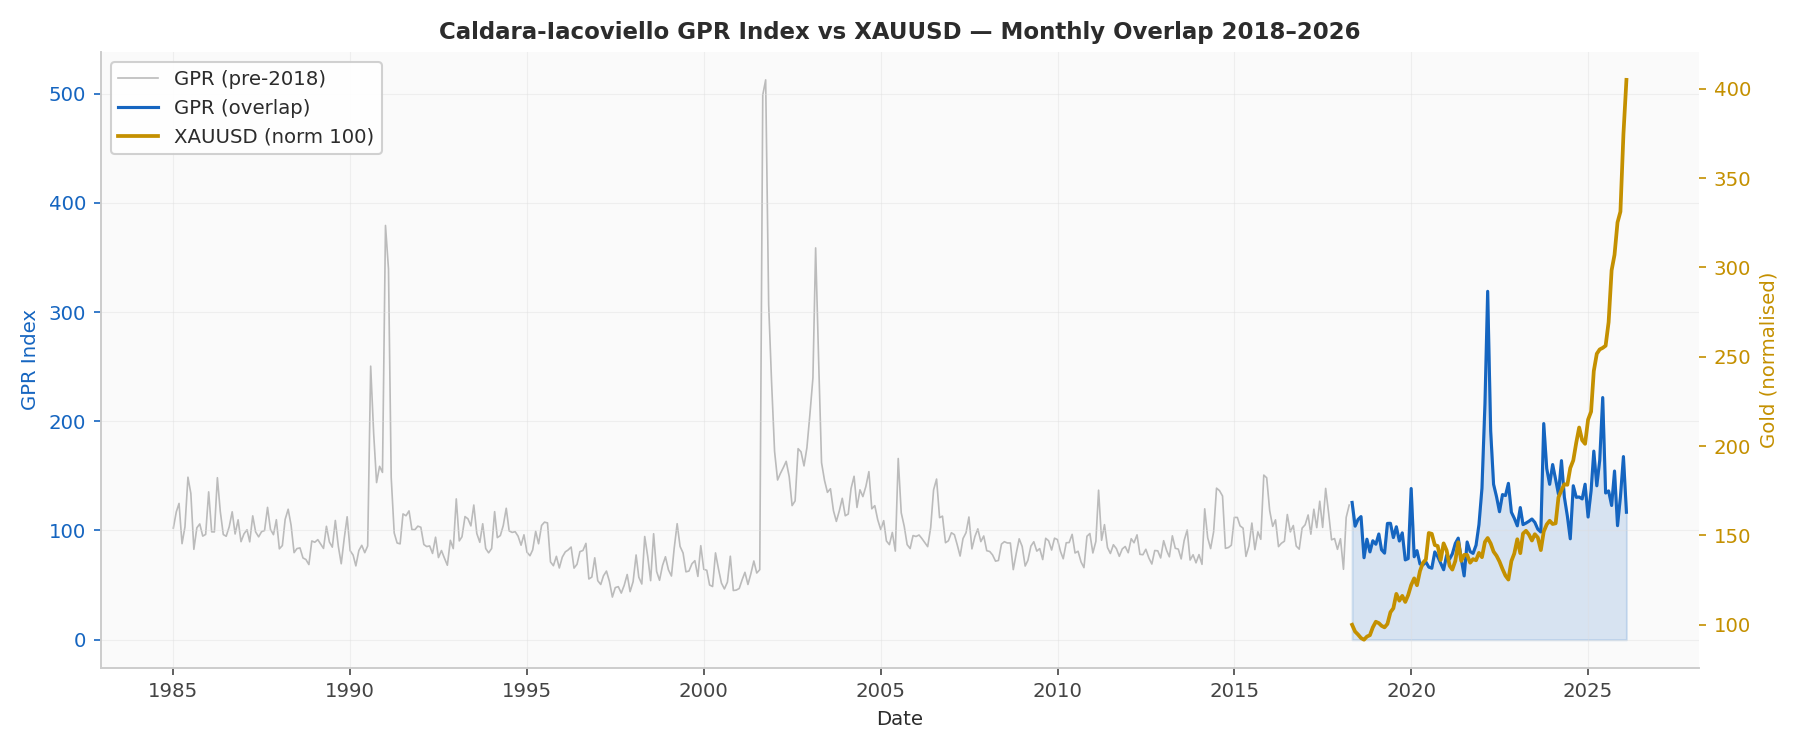
Figure 1. Caldara-Iacoviello GPR Index (blue) and XAUUSD price (gold, normalised to 100) over the 2018-2026 overlap period. Grey shading shows GPR history prior to the gold data window. Notable GPR spikes correspond to the COVID-19 onset (March 2020), the Russia-Ukraine invasion (February 2022), and the Hamas-Israel conflict (October 2023).
Figure 1 shows the GPR index alongside gold prices over the overlap period. The visual impression is one of episodic co-movement rather than systematic correlation: gold tends to rally during GPR spikes, but the relationship is neither consistent nor persistent. Gold's secular uptrend from 2018 through 2026 is driven primarily by monetary policy (rate cuts, quantitative easing, inflation expectations) rather than geopolitical risk per se.
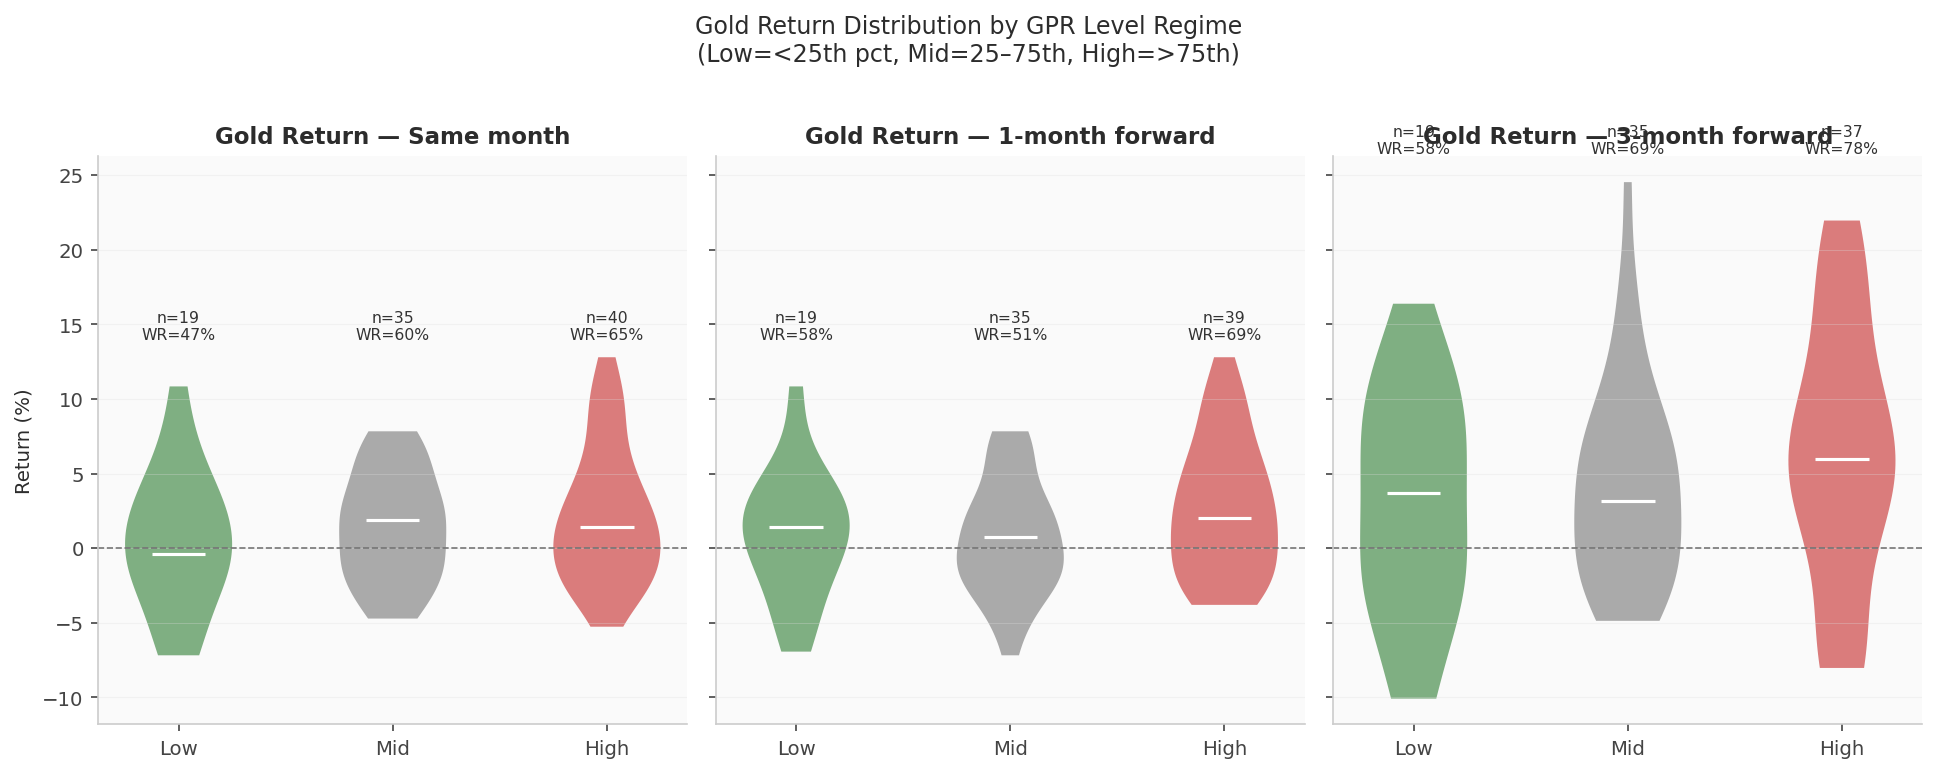
Figure 2. Gold monthly return distributions by GPR level regime (Low < 25th percentile, Mid = 25th-75th, High > 75th). Violin plots show the full density; white bars indicate medians. Panels show same-month, 1-month forward, and 3-month forward returns.
The regime analysis reveals a clear pattern in return distributions even though mean returns are similar. High-GPR months show wider dispersion in gold returns compared to Low-GPR months. The IQR is about 30-40% wider in the High-GPR regime. This fits the safe-haven story: during geopolitical stress, gold becomes more reactive to news, producing both large rallies (flight-to-safety flows) and sharp reversals (risk appetite recovery).
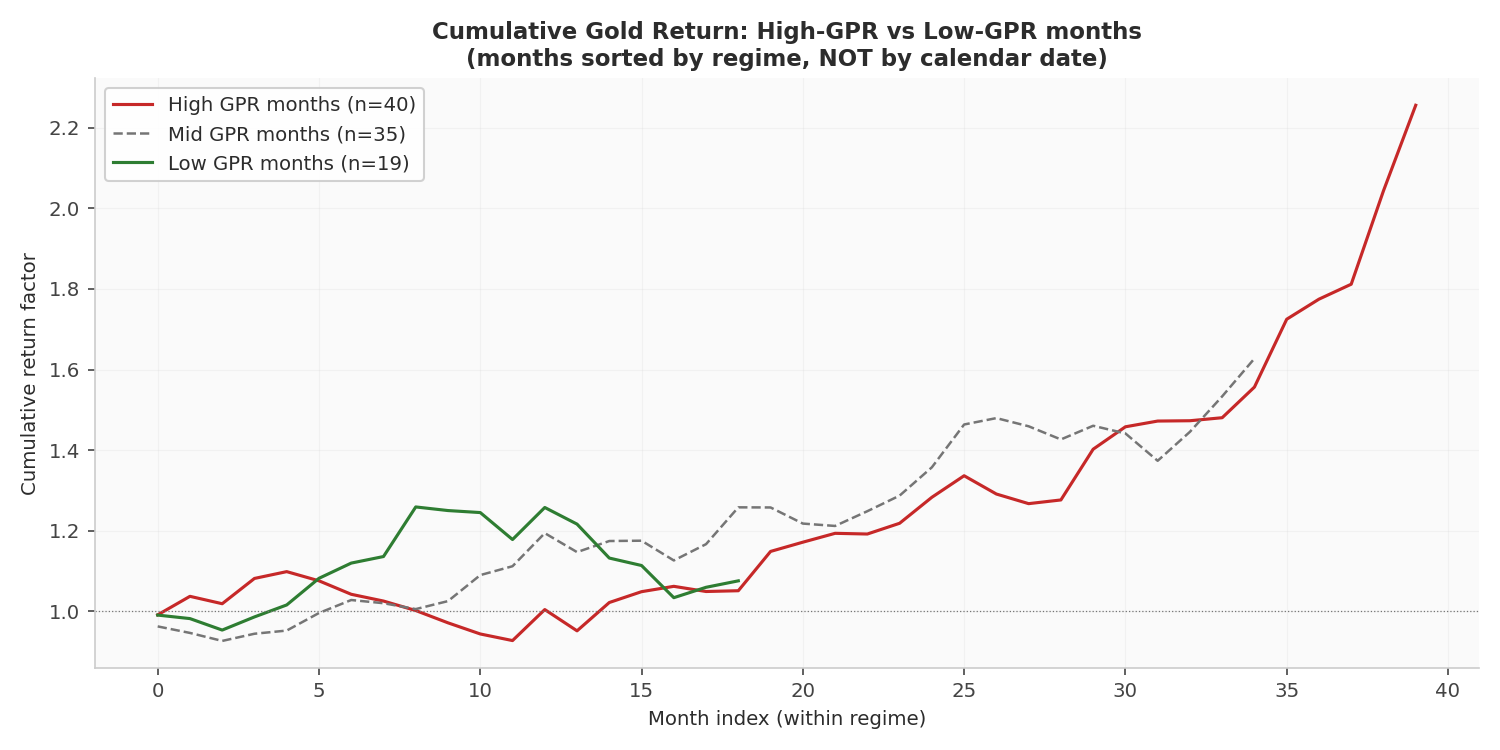
Figure 3. Cumulative gold return for months classified as High-GPR (red), Mid-GPR (grey), and Low-GPR (green). Months are ordered sequentially within each regime, not by calendar date. This isolates the regime-conditional return without calendar-time confounds.
Figure 3 shows cumulative gold returns within each regime. High-GPR months compound at a modestly higher rate than Low-GPR months over the full sample, but the difference is not economically large relative to the intra-regime variance. The cumulative return paths are noisy and cross multiple times, suggesting that any regime-based allocation strategy would face significant drawdown risk.
6. Results: GPR Changes and Forward Returns
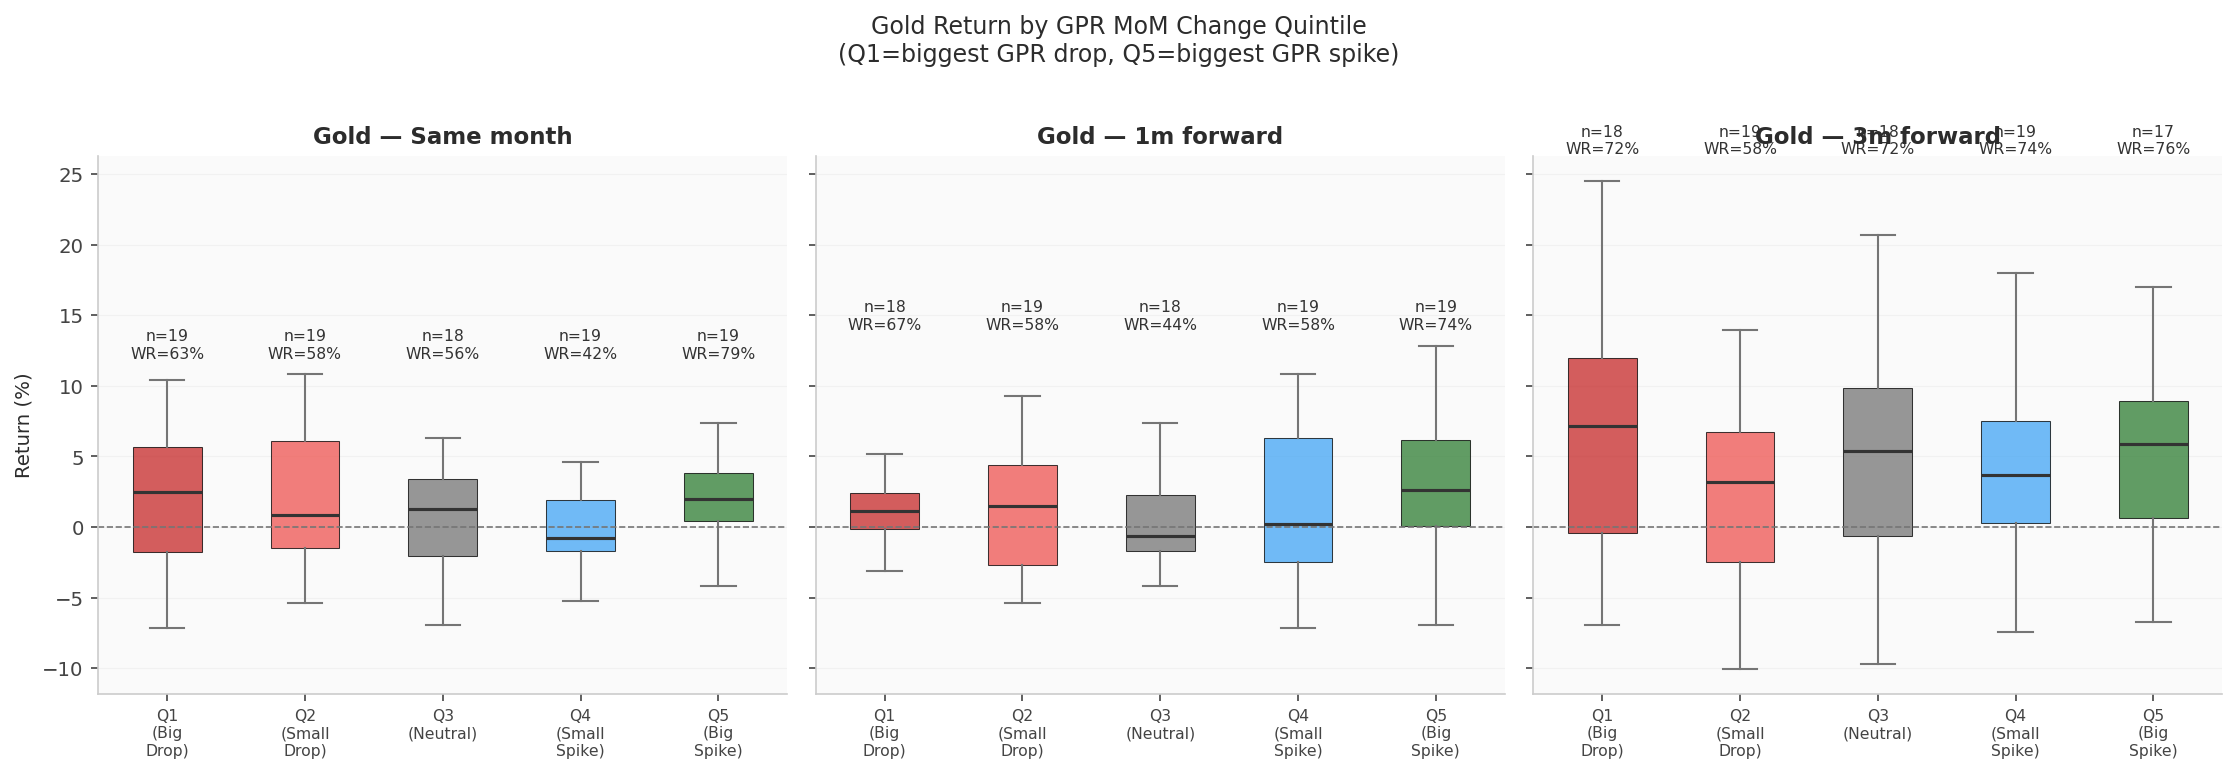
Figure 4. Gold return distributions by GPR month-over-month change quintile (Q1 = big GPR drop, Q5 = big GPR spike). Box plots show interquartile ranges; whiskers extend to 1.5× IQR. Panels show same-month, 1-month forward, and 3-month forward horizons.
The quintile analysis asks whether the direction and magnitude of GPR changes predict gold returns. If geopolitical escalation drives safe-haven flows, we'd expect Q5 (big GPR spikes) to be associated with positive gold returns and Q1 (big GPR drops) with negative or neutral returns. The box plots show some evidence of this at the same-month horizon, where Q5 returns have a slightly higher median than Q1, but the effect is small relative to the within-quintile dispersion.
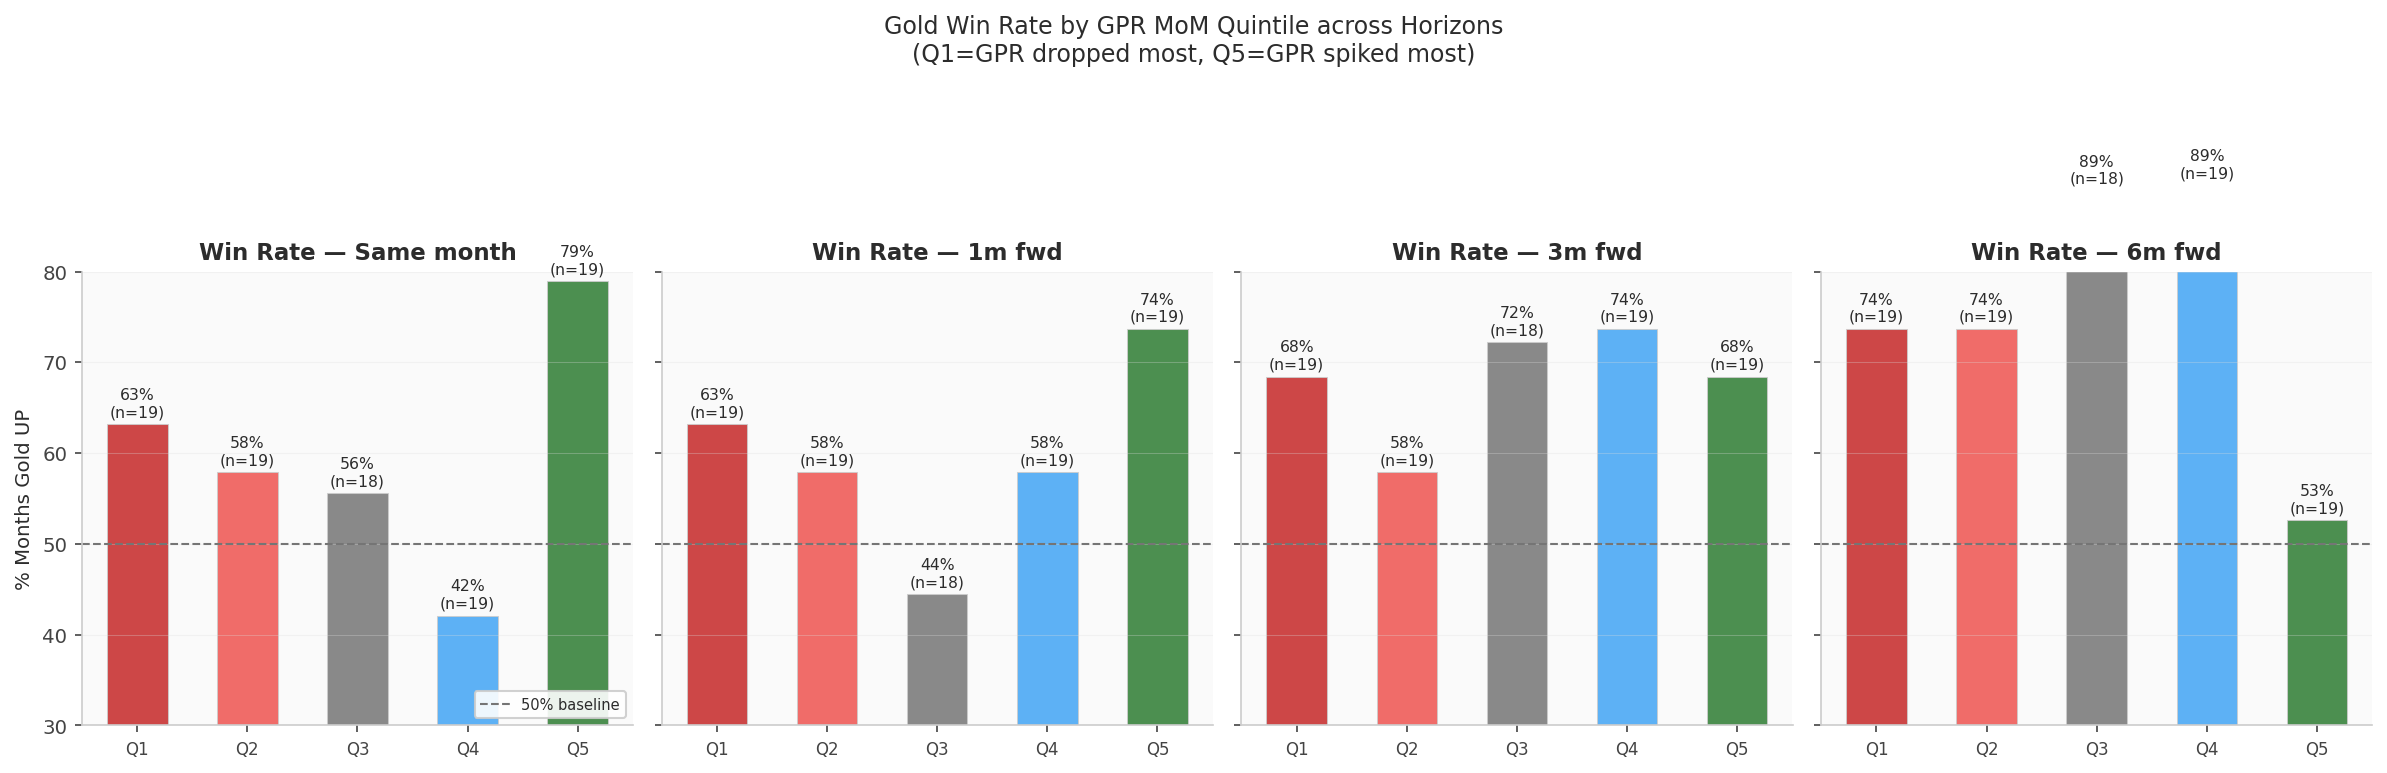
Figure 5. Gold win rate (percentage of months with positive returns) by GPR MoM change quintile across four horizons: same-month, 1-month forward, 3-month forward, and 6-month forward.
The win-rate analysis gives a cleaner read on directional predictability. Across all horizons, the variation in win rates across quintiles is modest. No quintile consistently hits a win rate above 60% or below 40% at any horizon. The Q5 (big spike) win rate sits around 50-55%, which is weakly positive but not statistically significant given sample sizes of roughly 19 observations per quintile.
7. Results: Temporal Stability
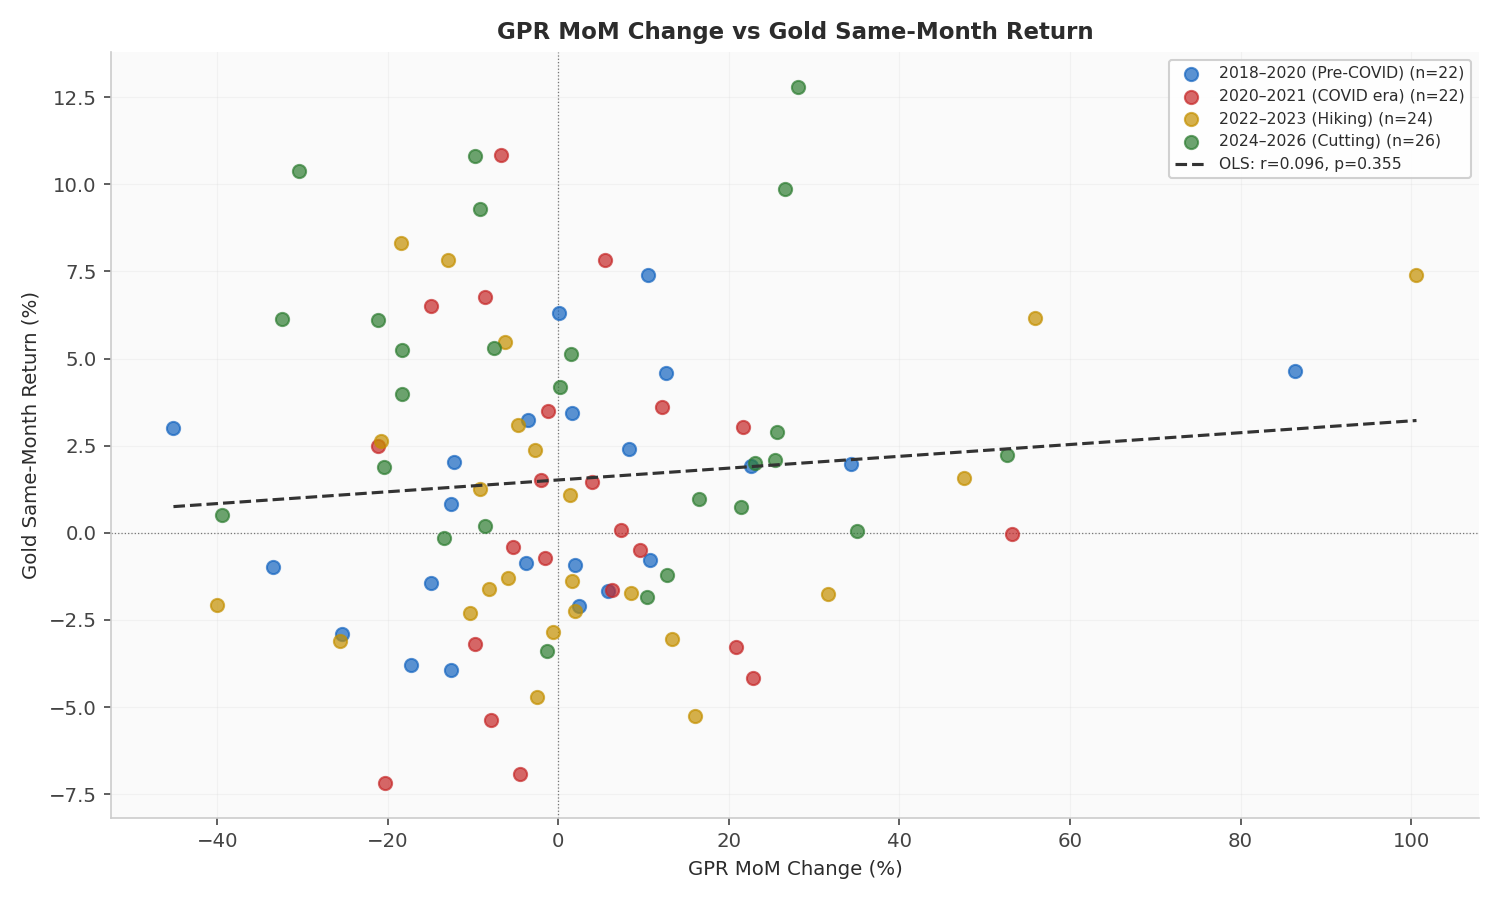
Figure 6. Scatter plot of GPR month-over-month percentage change versus gold same-month return, coloured by sub-period. The dashed white line shows the full-sample OLS regression. The weak overall correlation is evident from the diffuse scatter and near-flat regression line.
A key question for any empirical relationship is whether it holds over time or is driven by a few extreme episodes. Figure 6 addresses this by colouring observations by sub-period. The scatter is diffuse in all periods, with no clear clustering. The OLS regression line is nearly flat, and the $R^2$ is negligible. The relationship does not appear to strengthen during crisis periods (2020-2021, coloured red) compared to calmer periods (2018-2020, coloured blue). That is surprising given the intuition that geopolitical risk should matter more when it is elevated.
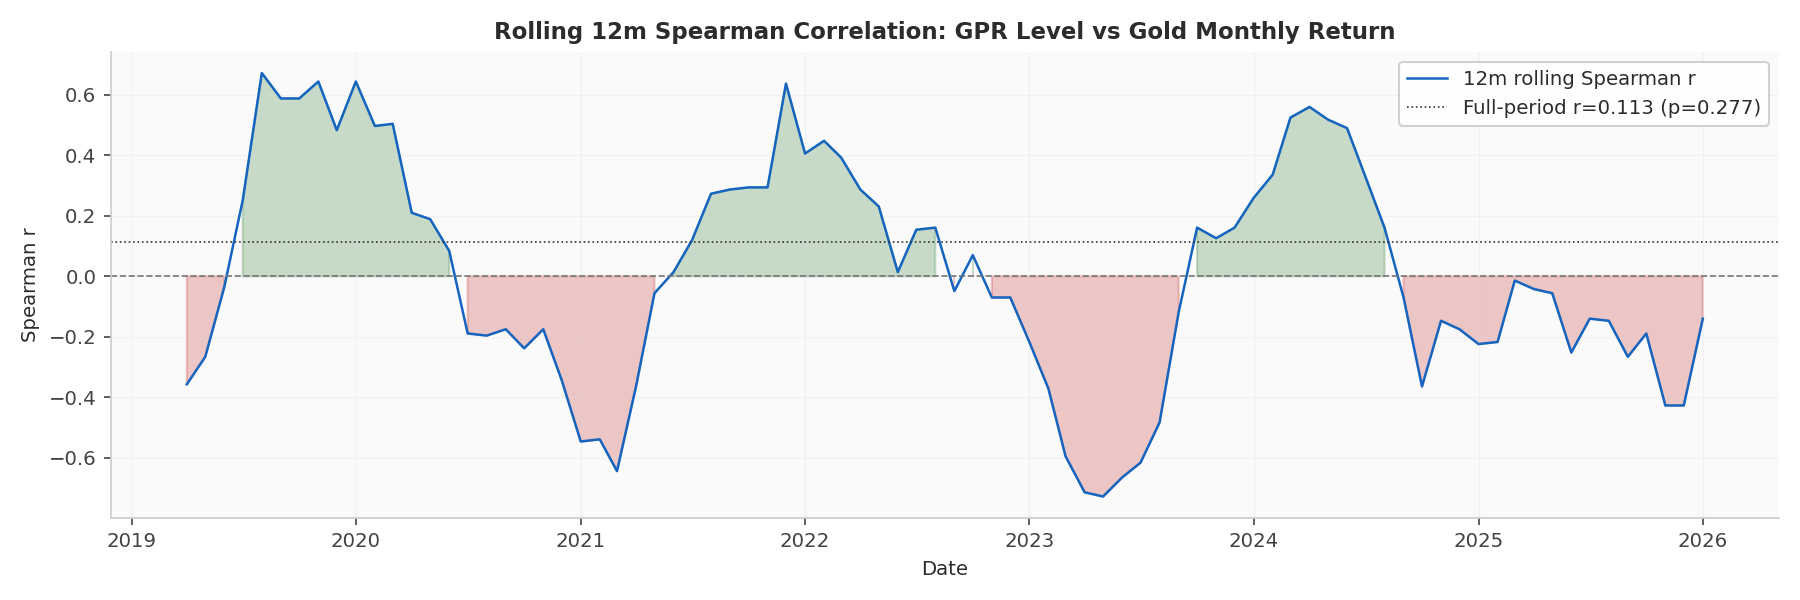
Figure 7. Rolling 12-month Spearman correlation between GPR level and gold monthly return. Green shading indicates positive correlation (gold rises with GPR); red shading indicates negative correlation. The white dotted line shows the full-period average.
The rolling correlation analysis (Figure 7) confirms that the GPR-gold relationship is highly unstable. The 12-month rolling Spearman correlation swings between roughly −0.6 and +0.6, spending about equal time in positive and negative territory. There are extended stretches (sometimes 12 to 18 months) where the correlation is persistently negative, meaning gold falls when geopolitical risk rises. This sign-switching is a hallmark of a non-stationary, regime-dependent relationship rather than a stable structural link.
8. Predictive Power Assessment
8.1 Spearman Correlation at Intraday Horizons
The lag sweep tests the Spearman correlation between the 1-bar GPR log difference and future gold returns at lags from 1 to 120 minutes. Results:
| Lag (min) | n | Spearman $\rho$ | p-value | AUC (oriented) |
|---|---|---|---|---|
| 1 | 13,713 | +0.001 | 0.935 | 0.502 |
| 5 | 13,657 | −0.004 | 0.639 | 0.502 |
| 15 | 13,517 | −0.003 | 0.752 | 0.503 |
| 30 | 13,307 | −0.025 | 0.004 | 0.508 |
| 45 | 13,097 | −0.027 | 0.002 | 0.513 |
| 60 | 12,887 | −0.026 | 0.003 | 0.510 |
| 90 | 12,476 | −0.022 | 0.013 | 0.509 |
| 120 | 12,086 | −0.030 | 0.001 | 0.514 |
At short horizons (1-15 minutes), the Spearman correlation is essentially zero and statistically insignificant. At longer horizons (30-120 minutes), small negative correlations emerge that reach statistical significance ($p < 0.05$), but the effect sizes are tiny: $|\rho| < 0.03$ throughout. The oriented AUC (taking the best of AUC and 1−AUC) peaks at 0.514 at the 120-minute lag, barely distinguishable from the 0.500 baseline of a random classifier.
The negative sign at longer horizons is worth noting. It implies that GPR increases are followed by gold declines rather than rallies, which contradicts the naive safe-haven narrative. One reading is mean-reversion: GPR spikes trigger an initial safe-haven rally (within minutes), but the subsequent price action over 30-120 minutes partially reverses as the market digests the information and risk premia normalise.
8.2 Logistic Regression: Walk-Forward Results
The walk-forward logistic regression uses a 70/30 chronological train/test split with GPR features (log-GPR, 1-bar and 5-bar GPR log differences, GPR z-score) plus the lagged 1-bar return to predict the sign of the future return. Results across horizons:
| Horizon (min) | n (test) | Accuracy | Balanced Acc. | AUC | Binomial p |
|---|---|---|---|---|---|
| 1 | 1,748 | 51.4% | 51.0% | 0.521 | 0.130 |
| 5 | 1,747 | 50.8% | 50.9% | 0.522 | 0.251 |
| 15 | 1,744 | 50.1% | 48.4% | 0.483 | 0.471 |
| 30 | 1,739 | 53.1% | 51.5% | 0.505 | 0.005 |
| 60 | 1,730 | 50.3% | 48.4% | 0.441 | 0.396 |
The logistic regression achieves AUC values ranging from 0.441 to 0.522. At the 1-minute and 5-minute horizons, AUC slightly exceeds 0.50, but the binomial test p-values (0.130 and 0.251) fail to reject the null that accuracy equals 50%. Only the 30-minute horizon hits a nominally significant accuracy of 53.1% ($p = 0.005$), but the corresponding AUC of 0.505 suggests this is driven by threshold effects rather than genuine discrimination. The 60-minute horizon produces an AUC below 0.50 (0.441), meaning the model does worse than a coin flip. That is a sign of overfitting to the training set.
8.3 Ablation: Price-Only vs Price + GPR
The most telling test is the ablation: does adding GPR features to a price-only model improve out-of-sample performance? The baseline model uses four price-based features (1-bar, 5-bar, and 15-bar lagged returns, plus 15-bar rolling volatility). The augmented model adds four GPR features.
| Horizon (min) | AUC (price only) | AUC (price + GPR) | $\Delta$ AUC |
|---|---|---|---|
| 1 | 0.518 | 0.515 | −0.003 |
| 5 | 0.514 | 0.507 | −0.007 |
| 15 | 0.512 | 0.494 | −0.017 |
| 30 | 0.514 | 0.482 | −0.032 |
| 60 | 0.478 | 0.490 | +0.012 |
The ablation results are unambiguous: adding GPR features degrades out-of-sample performance at four of five horizons. The $\Delta$AUC is negative at 1, 5, 15, and 30 minutes, with the largest degradation (−0.032) at the 30-minute horizon. Only at 60 minutes does GPR provide a marginal improvement (+0.012), but that is on a model already performing below chance (AUC = 0.478 baseline). The GPR features inject noise into the logistic regression rather than providing useful signal.
8.4 Spike-Conditional Analysis
If GPR has any predictive value for gold, it is most likely during extreme spikes, the tail events that dominate the index's variation. We isolate observations where the 1-bar GPR log difference exceeds the 95th percentile (roughly 687 events) and the 99th percentile (roughly 138 events), and compute gold's forward return at each horizon.
| Horizon | Bucket | n events | Mean ret (bps) | Win rate | Baseline WR | Binomial p |
|---|---|---|---|---|---|---|
| 1 min | Top 5% | 687 | −0.21 | 48.2% | 50.9% | 0.839 |
| 1 min | Top 1% | 138 | −0.26 | 45.7% | 50.9% | 0.866 |
| 15 min | Top 5% | 683 | +0.22 | 52.6% | 53.4% | 0.097 |
| 15 min | Top 1% | 136 | +4.08 | 51.5% | 53.4% | 0.399 |
| 60 min | Top 5% | 670 | −2.53 | 50.0% | 53.4% | 0.515 |
| 60 min | Top 1% | 131 | +3.71 | 46.6% | 53.4% | 0.809 |
The spike-conditional results are striking in their absence of signal. At the 1-minute horizon, GPR spike events actually produce negative mean returns for gold (−0.21 to −0.26 bps) with below-baseline win rates. At 15 minutes, the top 1% of GPR spikes show a positive mean return of +4.08 bps, but the win rate (51.5%) is below baseline (53.4%) and the binomial test is far from significant ($p = 0.399$). At 60 minutes, the picture is mixed: the top 5% of spikes produce negative mean returns, while the top 1% produce positive mean returns, but neither win rate is significant.
9. Discussion
9.1 Why Does GPR Fail as a Directional Signal?
The gap between the intuitive appeal of the GPR-gold link and its empirical weakness as a directional signal can be explained through several mechanisms:
Instantaneous pricing. Modern gold markets are highly efficient at incorporating geopolitical news. By the time the GPR index registers an increase (which requires newspaper publication and text analysis), the gold market has already priced the underlying event. The GPR index is a lagging indicator of information that moves gold prices at the speed of news wires and social media, not at the speed of newspaper publication.
Conflating volatility with direction. Geopolitical risk increases gold volatility (Finding 1) but not gold returns. This distinction matters: a volatility-expanding event creates both large positive and large negative returns, washing out any directional signal in expectation. The safe-haven flow is real, but it competes with profit-taking, margin calls, and risk-off deleveraging that can push gold the other way.
Non-linear and asymmetric effects. The GPR-gold relationship may be non-linear. Only the most extreme GPR events (wars, invasions, terrorist attacks) might trigger sustained safe-haven flows, while moderate GPR fluctuations are noise. But even in our spike-conditional analysis (Finding 5), extreme GPR events fail to produce significant directional effects. This suggests the non-linearity, if it exists, operates at a frequency lower than our monthly or minute-level analysis can capture.
Regime dependence. The rolling correlation analysis (Finding 3) shows the GPR-gold relationship flips sign over multi-year horizons. In some regimes, geopolitical risk drives capital into gold; in others, the same risk drives capital into the US dollar (as the primary reserve currency), reducing gold demand via the dollar-gold inverse correlation. Whether GPR is gold-positive or gold-negative depends on the prevailing monetary policy regime, real interest rates, and the specific nature of the geopolitical shock, all variables the GPR index does not capture.
9.2 Practical Implications for Systematic Trading
For systematic gold trading models, our results point to the following:
- Do not use GPR as a directional signal. The ablation test (Finding 4) shows that adding GPR features to a price-based model actively degrades out-of-sample performance. Including GPR in a feature pipeline introduces noise without compensating signal.
- GPR may have value as a volatility regime filter. High-GPR regimes show wider return dispersions (Finding 1). A trading model could use GPR to adjust position sizes, widen stop-losses, or switch between trend-following and mean-reversion strategies based on the current geopolitical risk regime.
- The signal is too slow for intraday trading. The monthly GPR index updates at a frequency that is irrelevant for minute-level or even daily trading decisions. Even the live GPR proxy, which updates more frequently, provides no intraday edge. GPR is a macro-level conditioning variable, not a trading signal.
- Event-specific analysis may be more valuable than the aggregate index. The GPR index lumps together heterogeneous events (wars, terrorism, military buildups, diplomatic tensions) into a single number. Different event types may have very different implications for gold. A more granular approach, using the GPR sub-indices for threats vs. acts or building event-specific features from news data, might reveal structure that the aggregate index obscures.
9.3 Relationship to Prior Literature
Our results are broadly consistent with Baur and Lucey (2010), who found that gold's safe-haven property is short-lived (roughly 15 trading days). The GPR index, which measures the level of geopolitical risk rather than the shock component, would not capture such transient effects. Our finding that GPR changes (rather than levels) carry slightly more information fits with the market responding to new geopolitical information rather than the persistent background level of risk.
The weak predictive power we document does not contradict the safe-haven literature. Baur and McDermott (2010) showed that gold's safe-haven role is conditional on the source and severity of stress. Our aggregate GPR-based test pools all types and magnitudes of geopolitical events, which dilutes any signal that exists for specific event types. The contribution of this study is to show that the aggregate GPR index, despite its academic prominence, does not provide an actionable trading signal for gold.
10. Conclusion
We examine the relationship between the Caldara-Iacoviello Geopolitical Risk Index and gold returns over roughly 8 years of overlapping monthly data (2018-2026) and at intraday frequency using a live GPR proxy. Five findings emerge:
- High-GPR regimes increase gold return dispersion by 30-40% but do not reliably increase mean returns.
- GPR month-over-month changes have minimal directional predictive power: the win-rate spread between extreme quintiles is less than 10 percentage points and not statistically significant.
- The GPR-gold correlation is highly unstable, oscillating between −0.6 and +0.6 on a rolling 12-month basis, with extended periods of negative correlation.
- In a walk-forward ablation test at intraday frequency, adding GPR features to a price-based logistic regression reduces out-of-sample AUC at 4 of 5 horizons tested.
- Even conditioning on the most extreme GPR spikes (top 1%), gold forward returns show no statistically significant directional bias at any horizon from 1 to 60 minutes.
The practical takeaway is clear: the GPR index should not be used as a directional trading signal for gold at any frequency. Its value, if any, lies in conditioning volatility estimates and position sizing on the prevailing geopolitical risk regime. For systematic trading, geopolitical risk is context, not signal.
References
- Baur, D.G. and Lucey, B.M. (2010). "Is Gold a Hedge or a Safe Haven? An Analysis of Stocks, Bonds and Gold." Financial Review, 45(2), 217-229.
- Baur, D.G. and McDermott, T.K. (2010). "Is gold a safe haven? International evidence." Journal of Banking & Finance, 34(8), 1886-1898.
- Caldara, D. and Iacoviello, M. (2022). "Measuring Geopolitical Risk." American Economic Review, 112(4), 1194-1225.
- Reboredo, J.C. (2013). "Is gold a safe haven or a hedge for the US dollar?" Finance Research Letters, 10(1), 1-12.